All images in charts/
This is a static gallery that embeds the images stored in the charts folder of this repository. Images are served from raw user content and will update automatically when the files are replaced.
To see charts without technicals go to
candlesticks
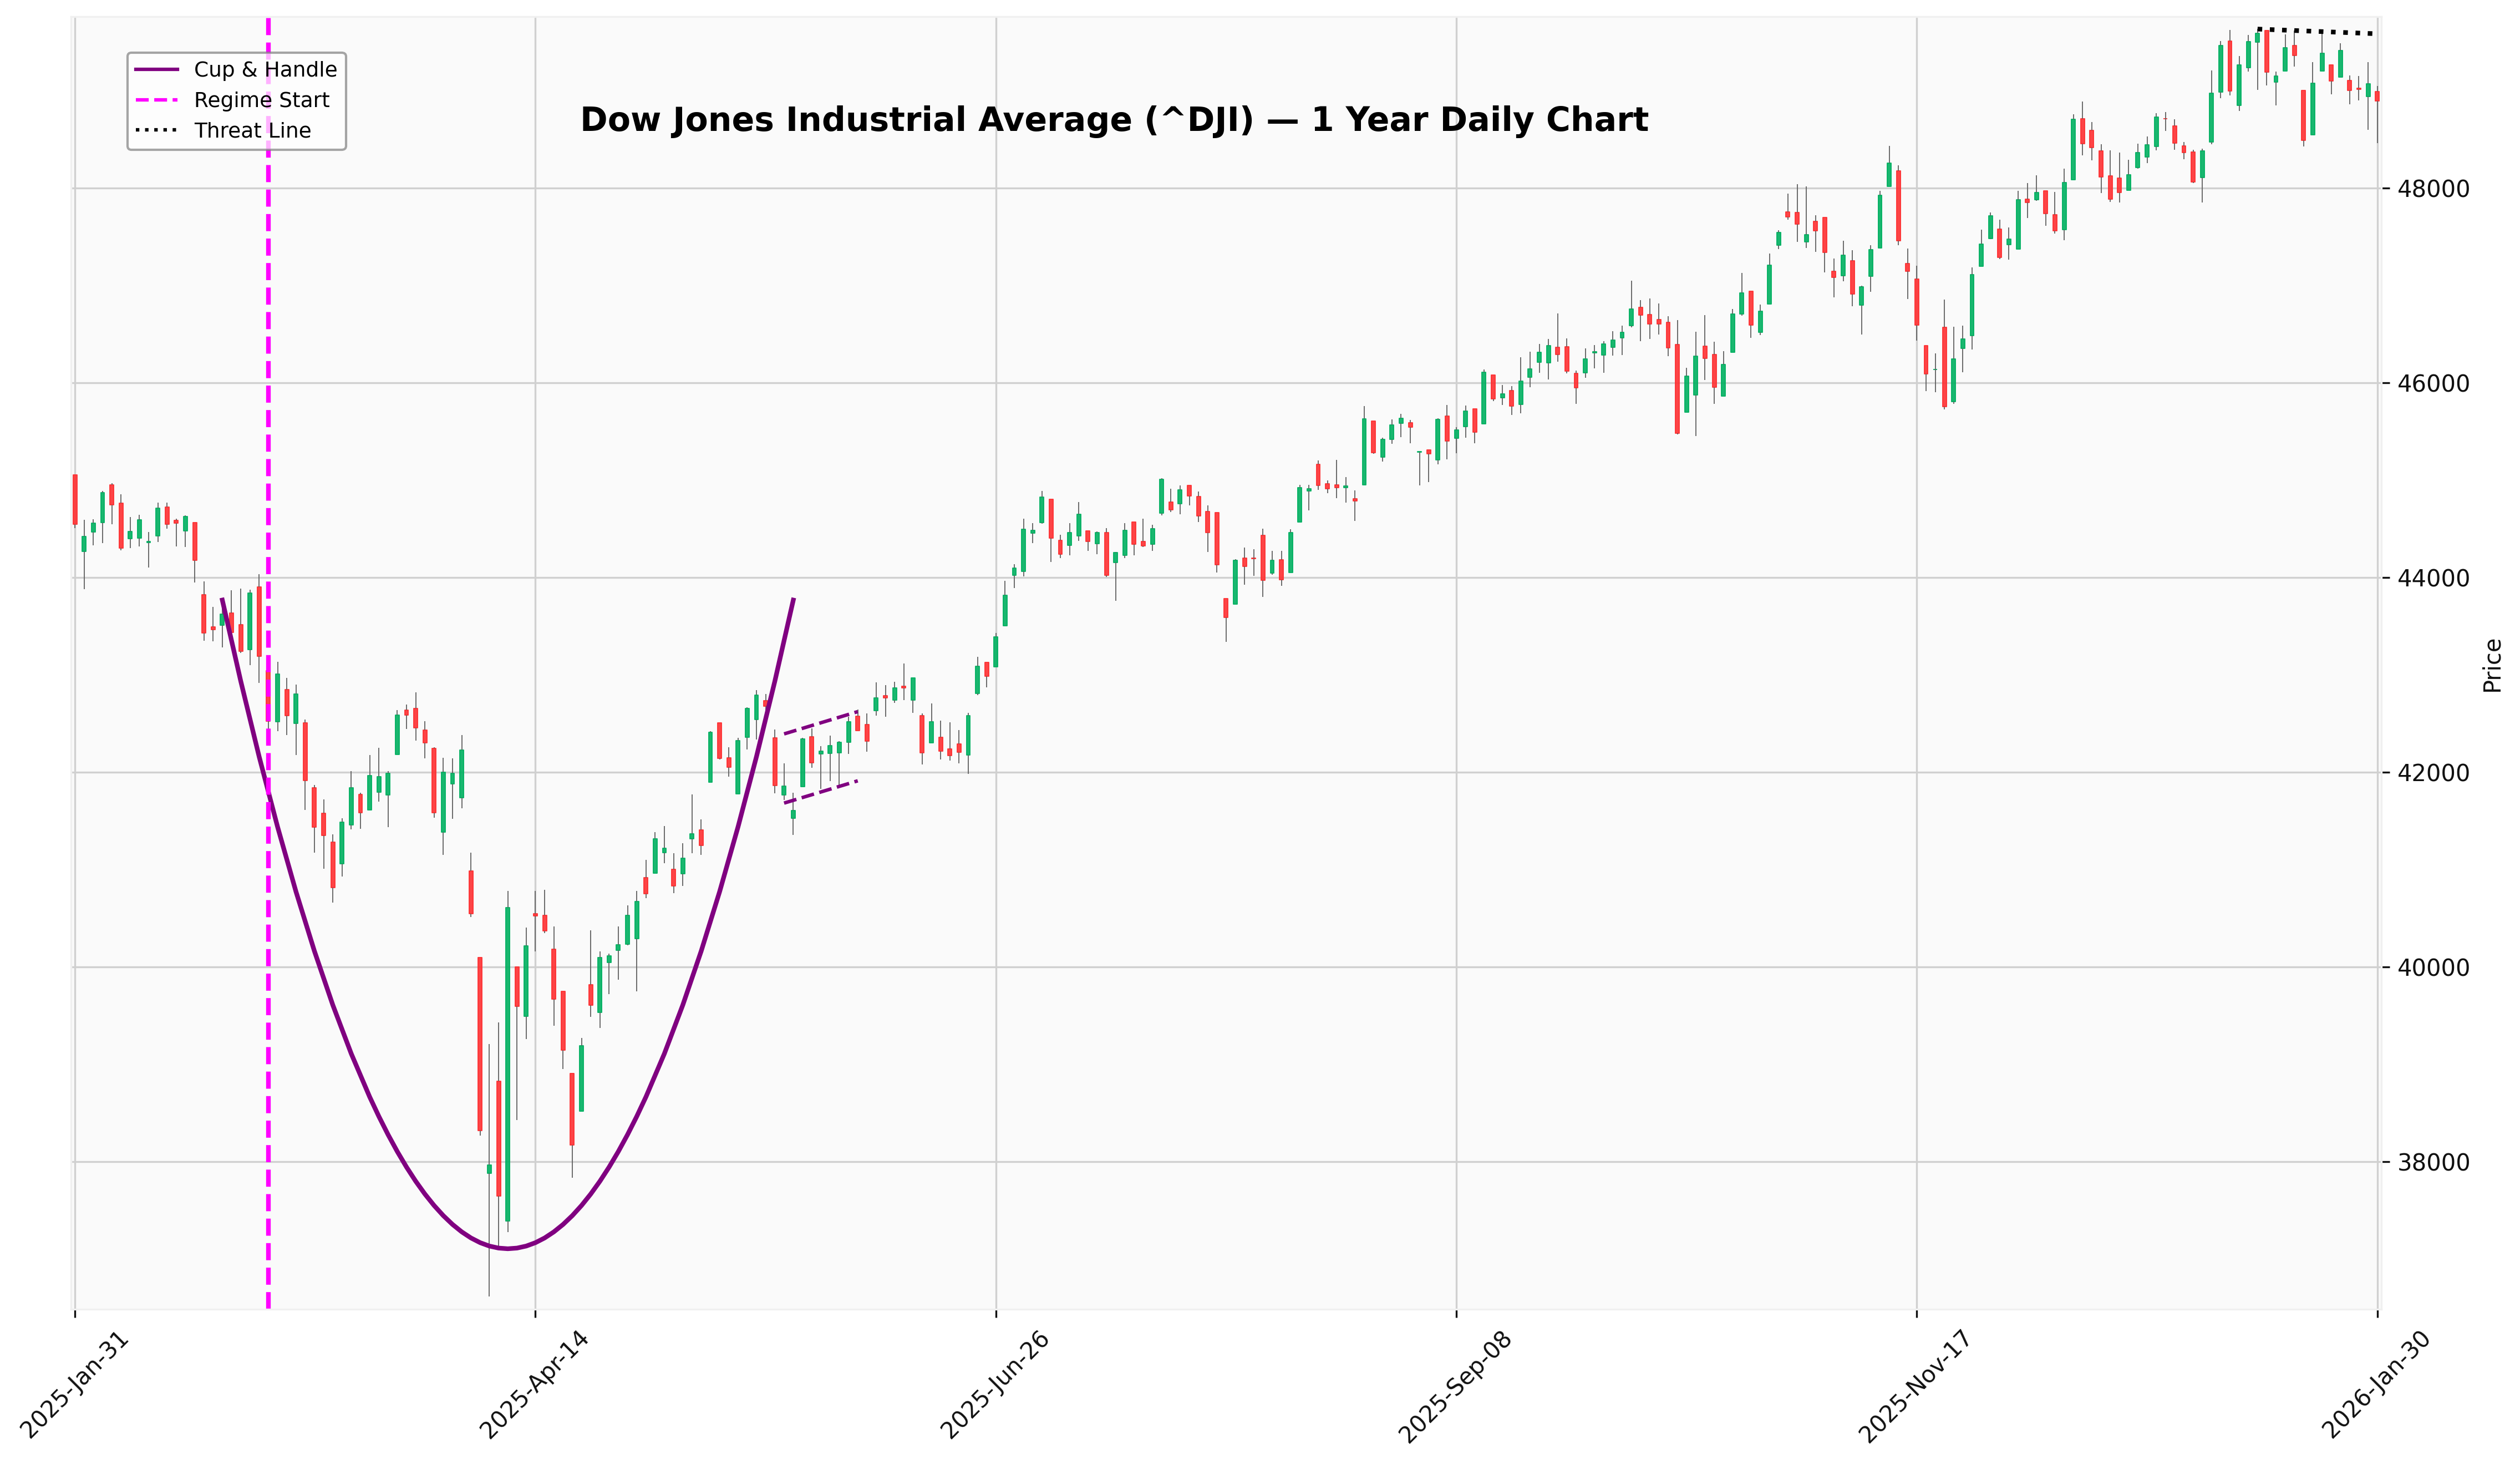
DJIA
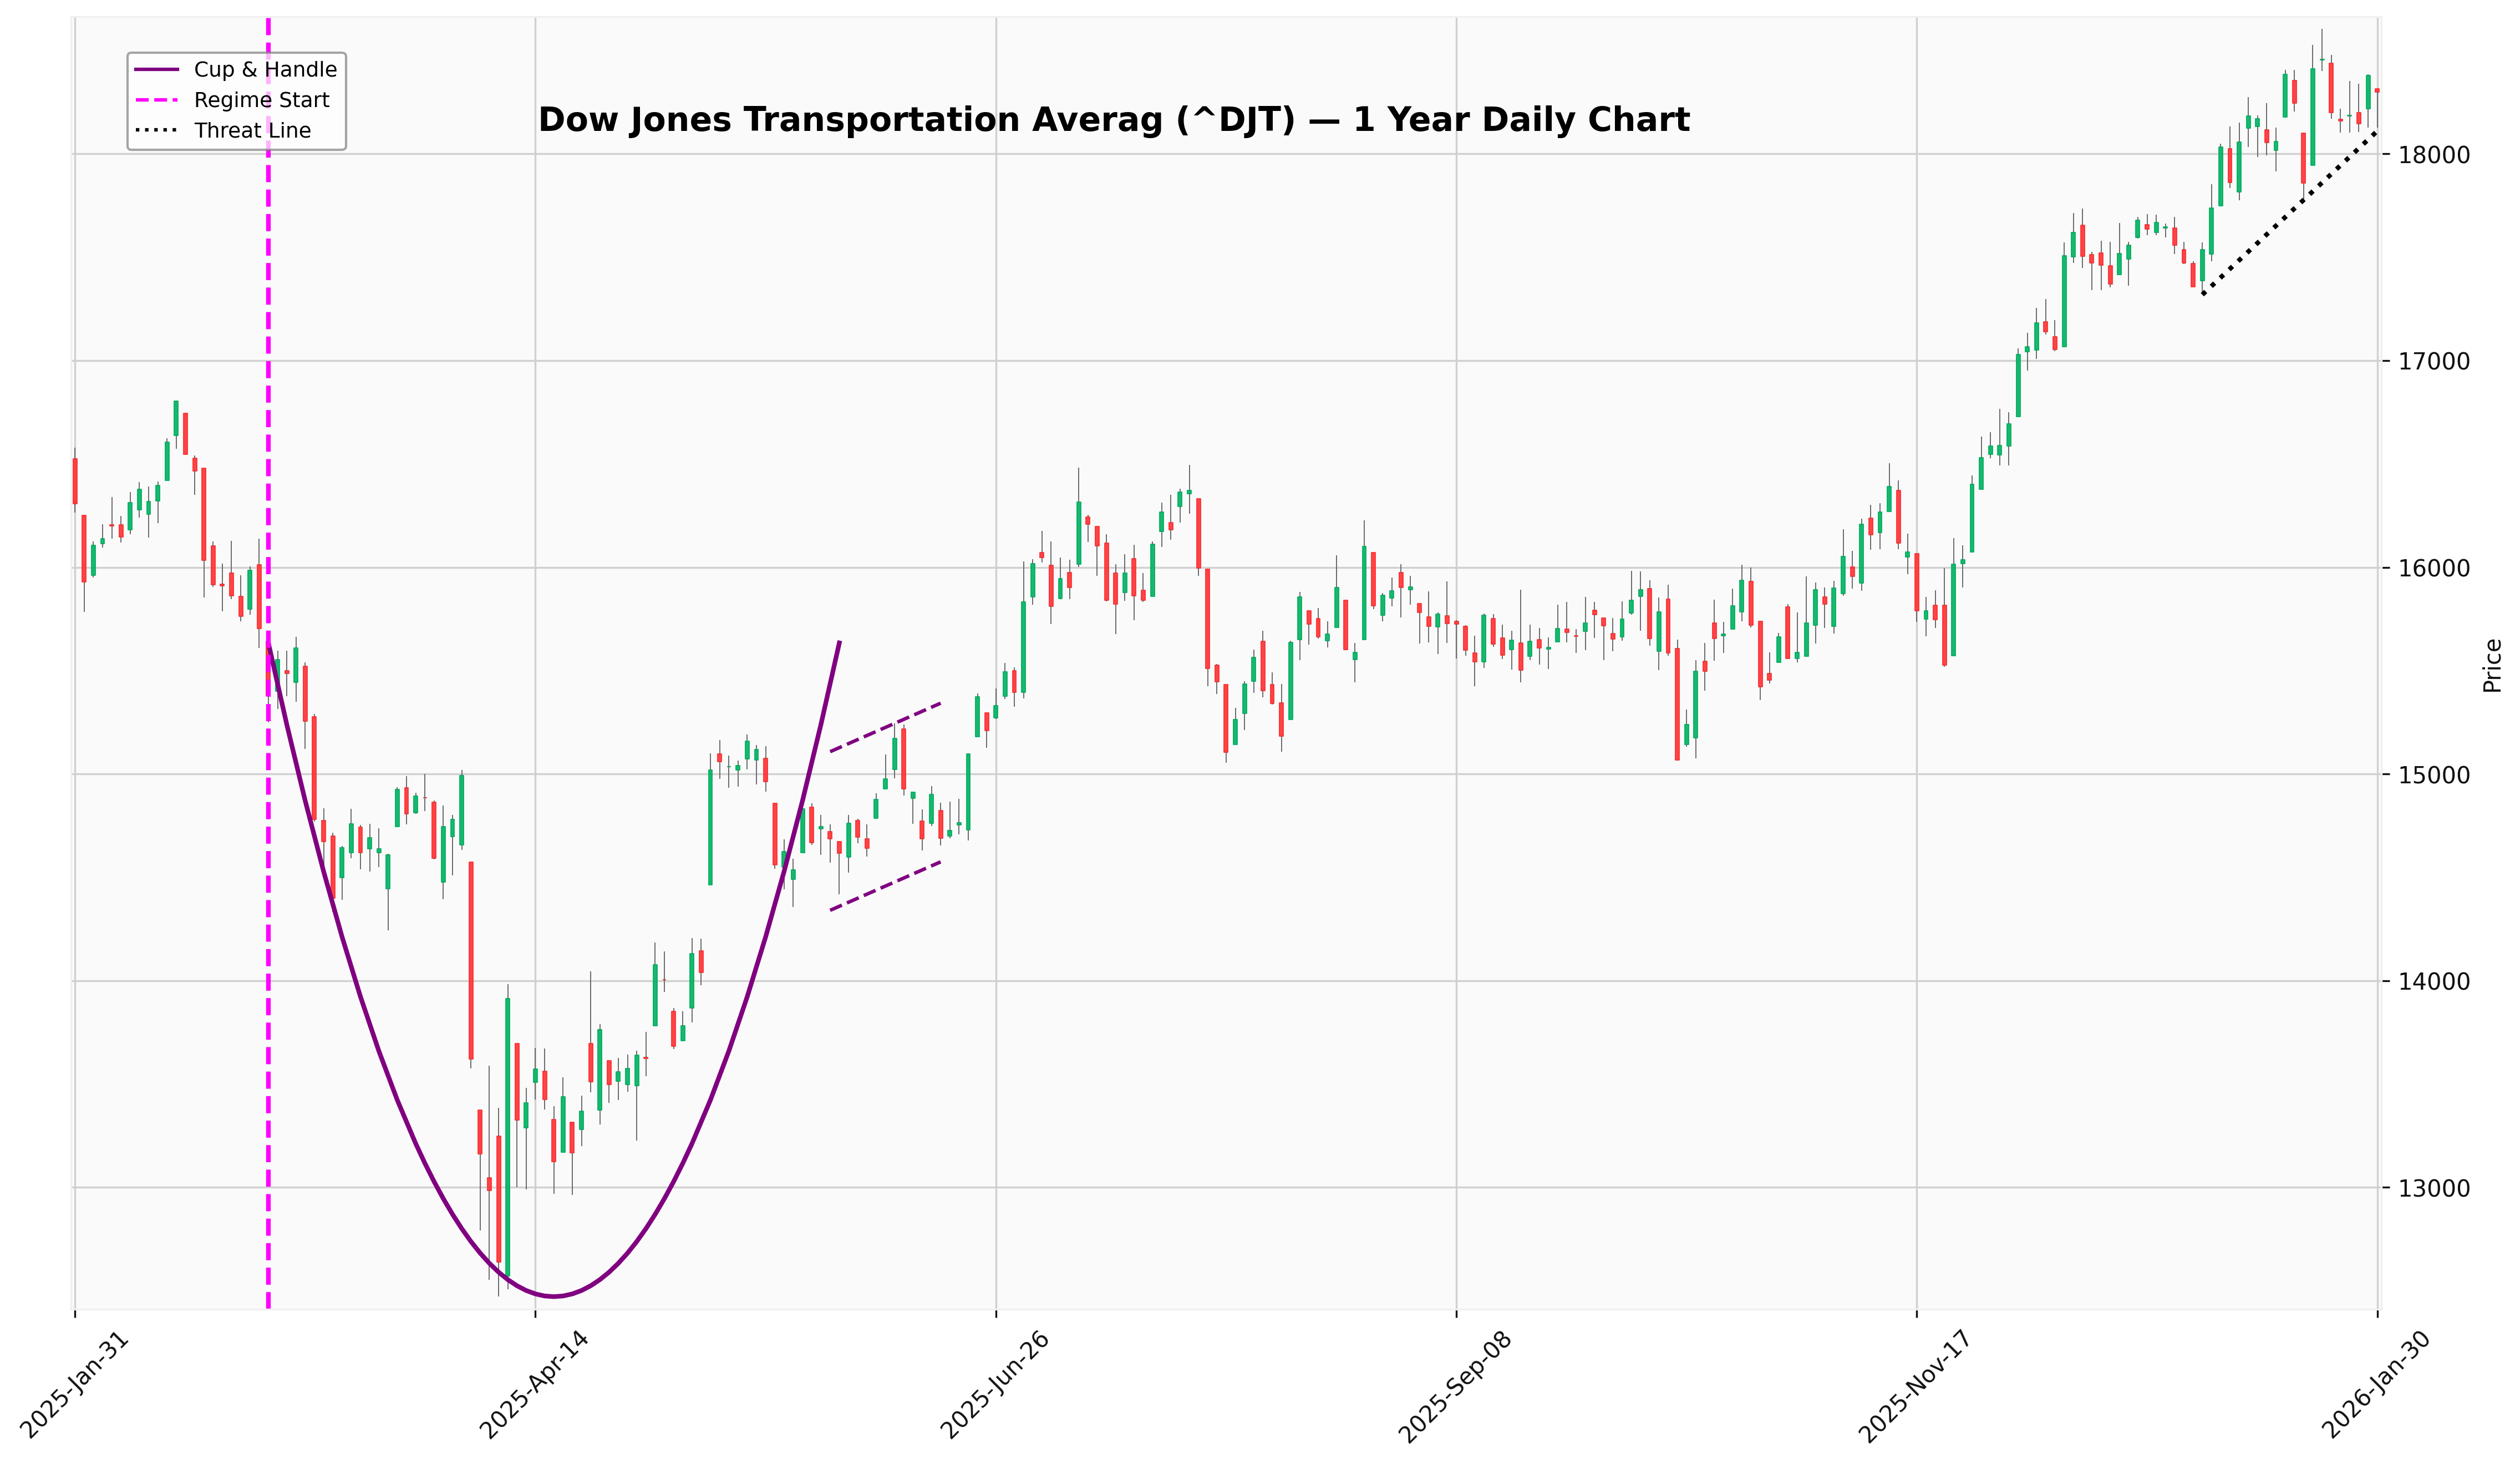
Transports
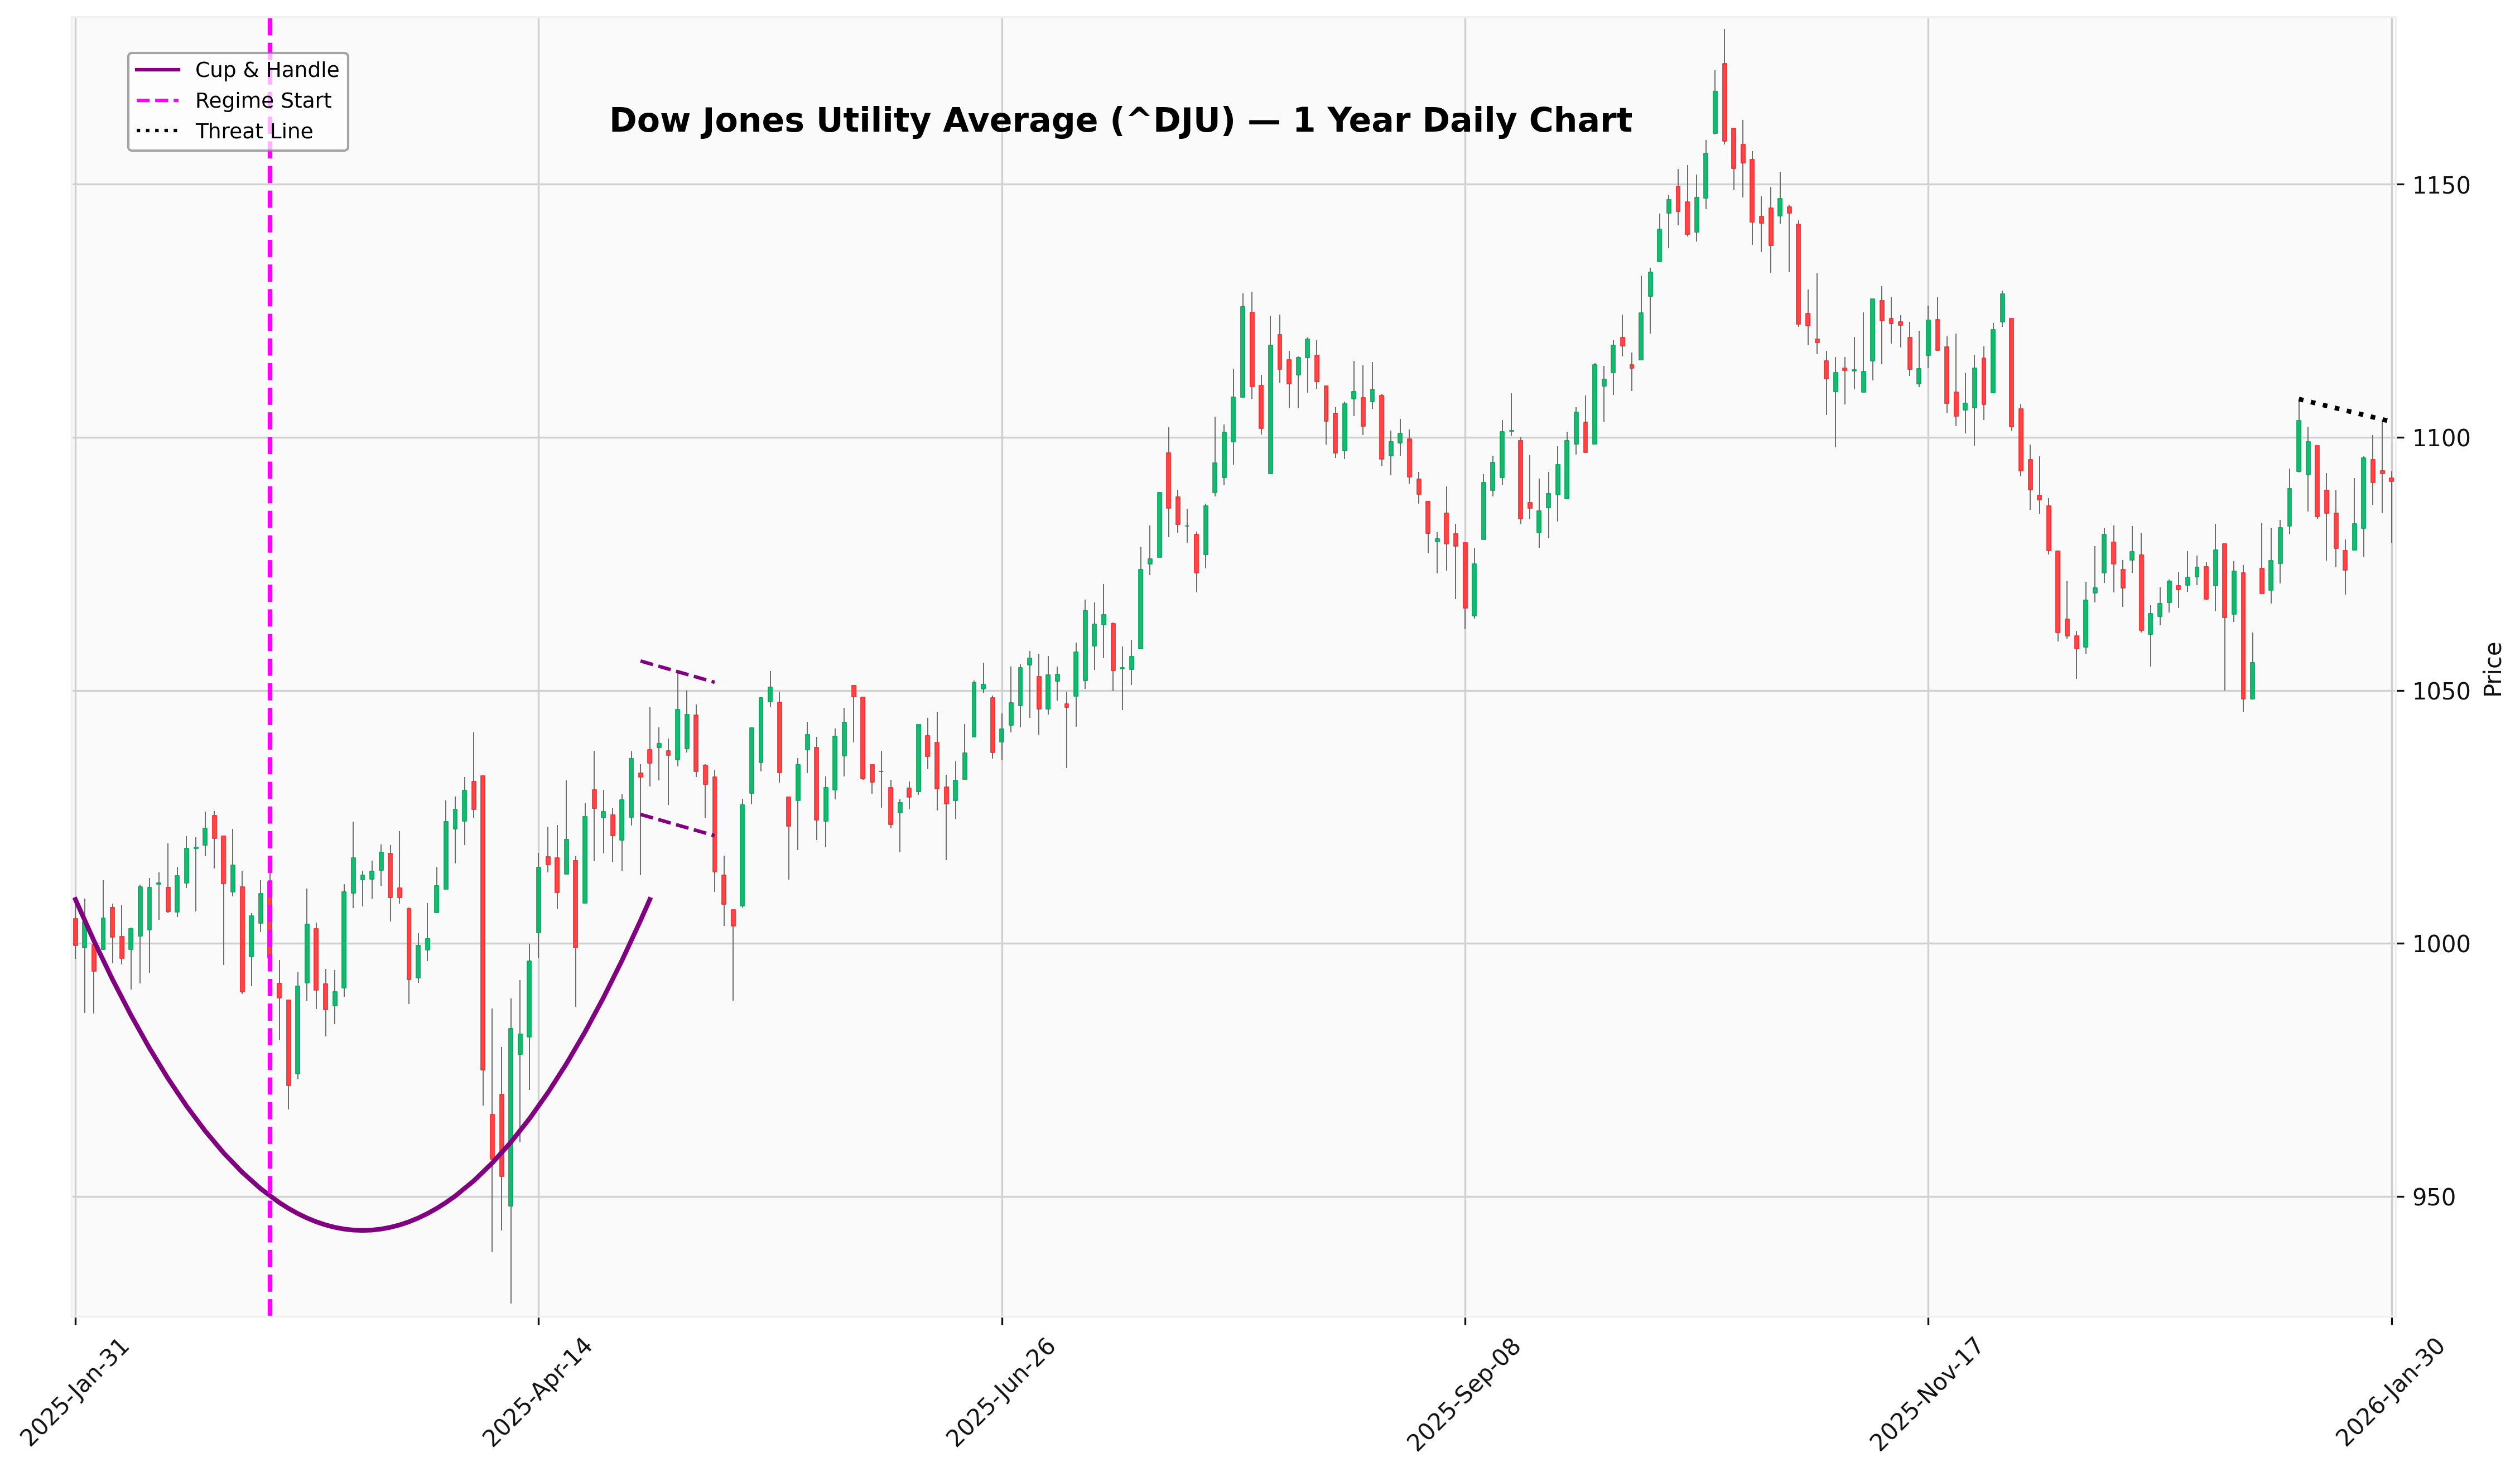
UTES
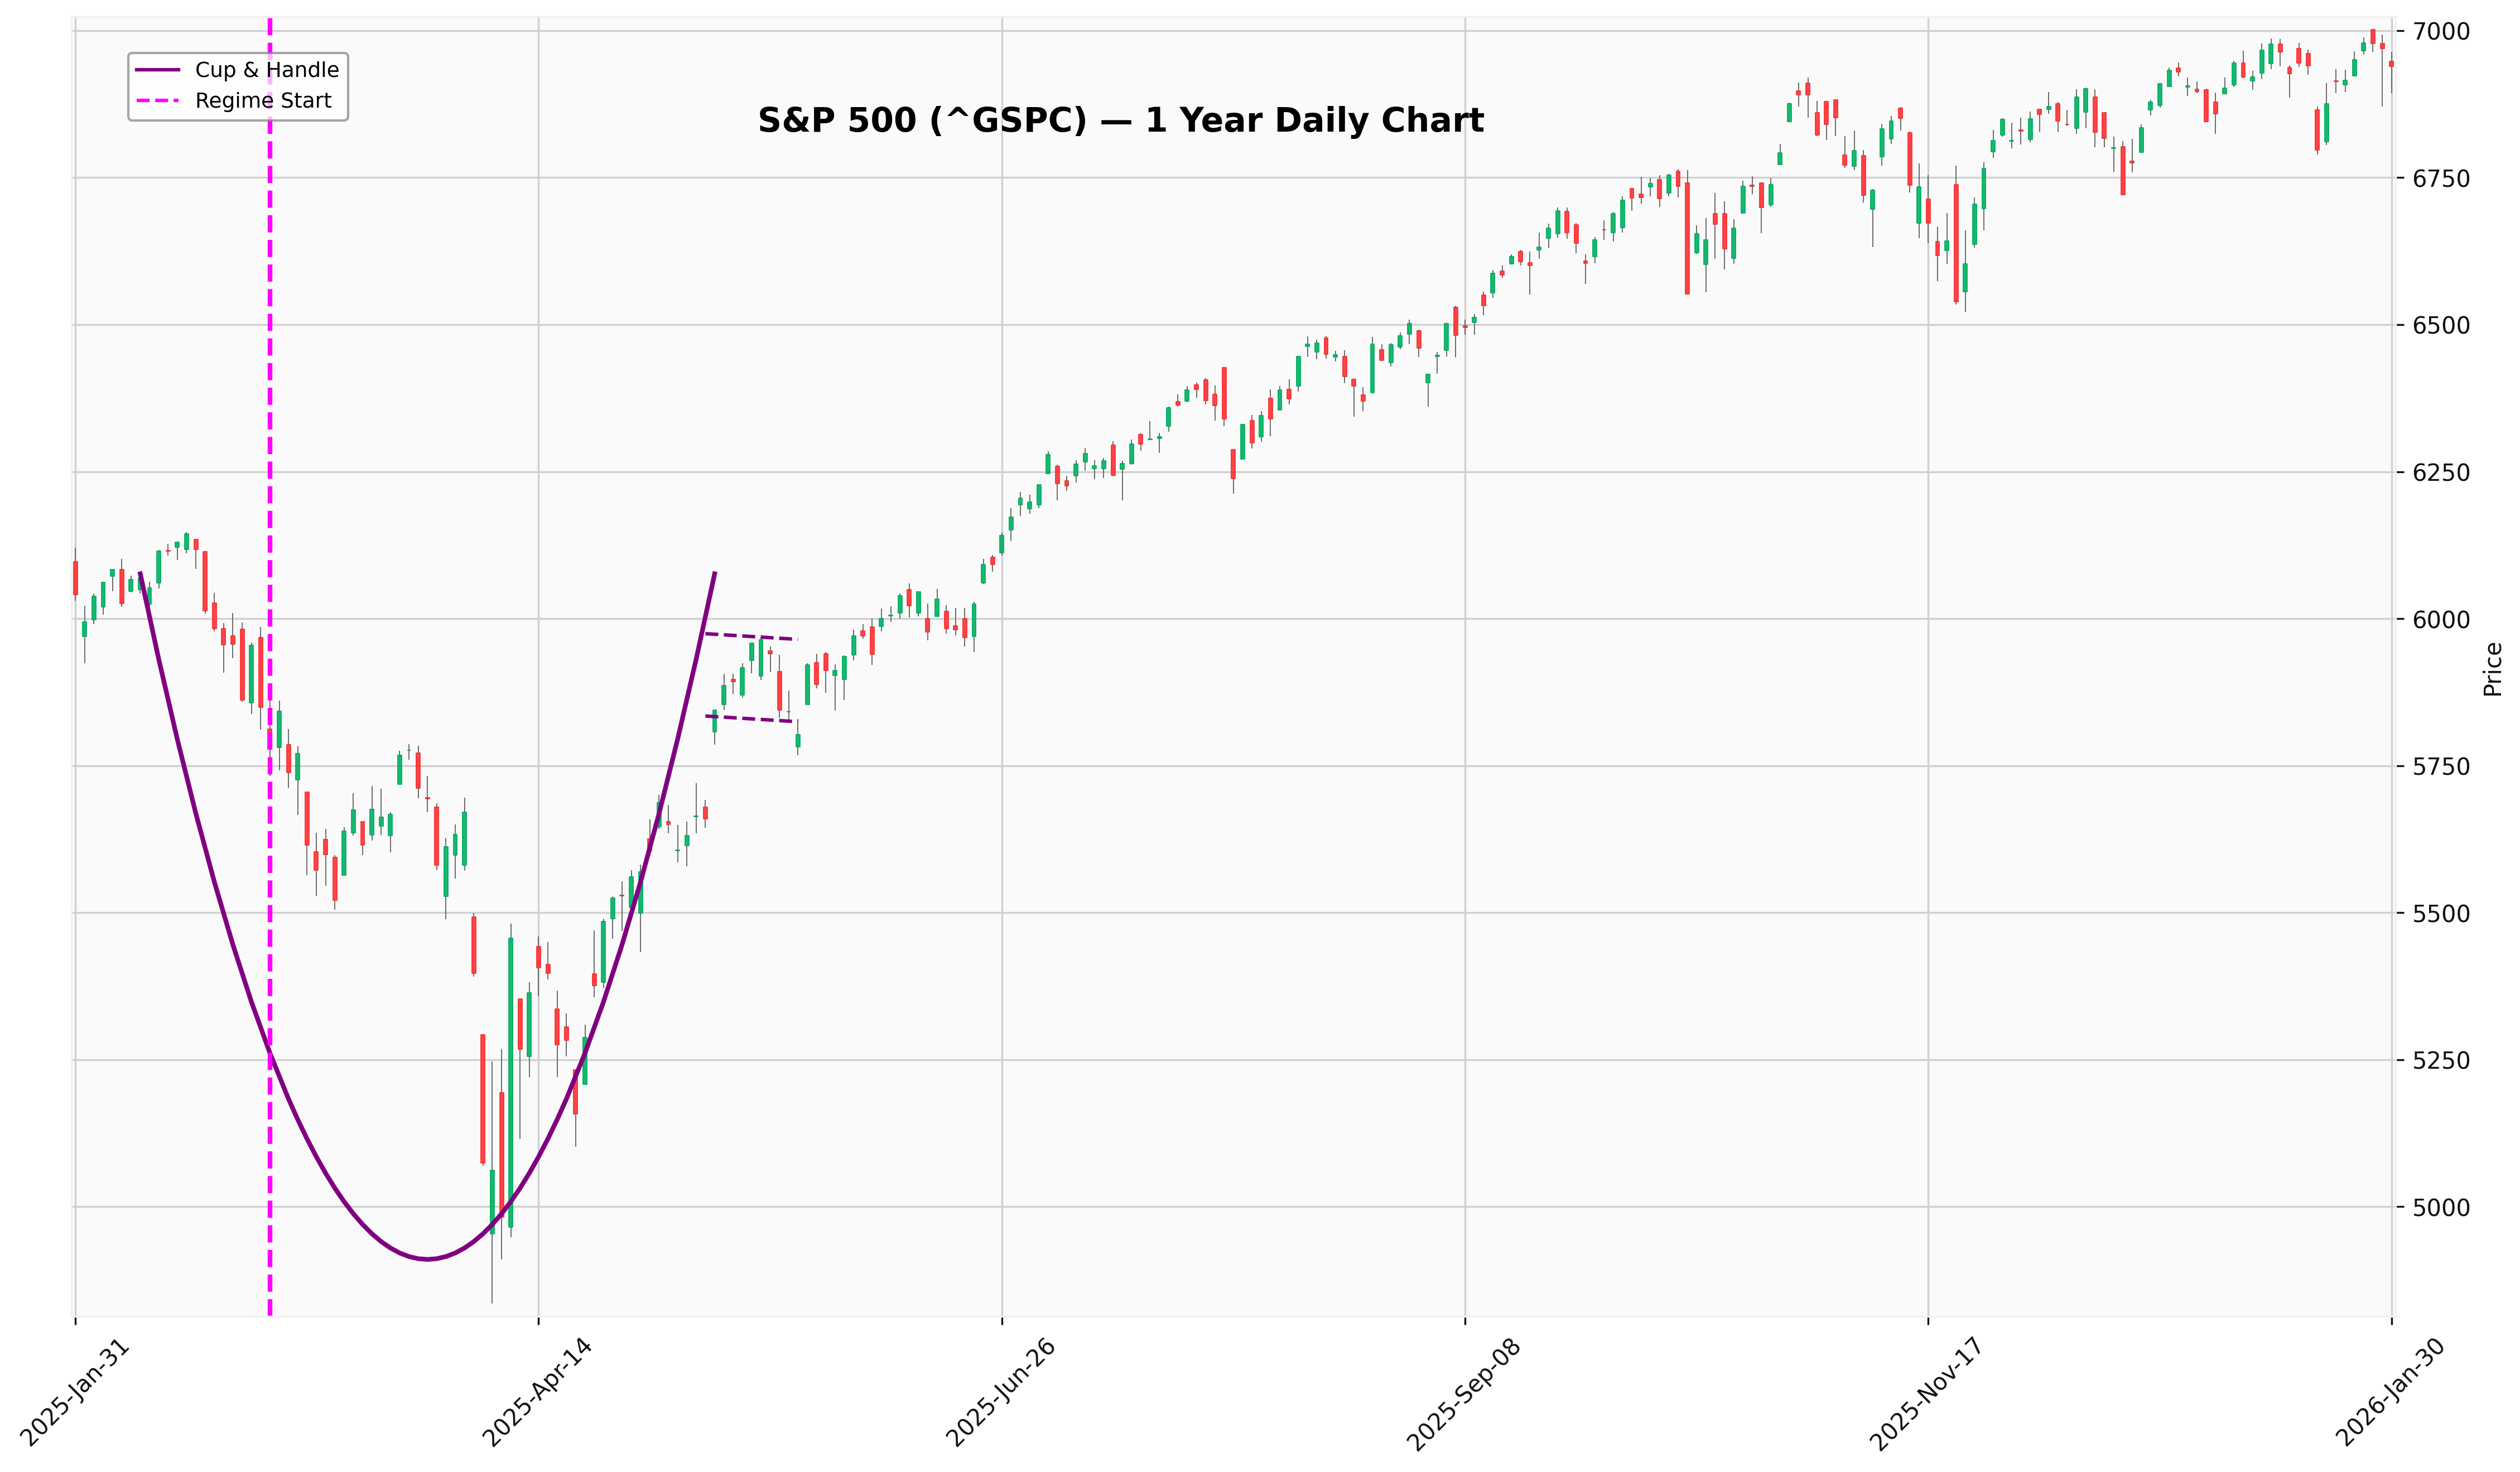
S&P500
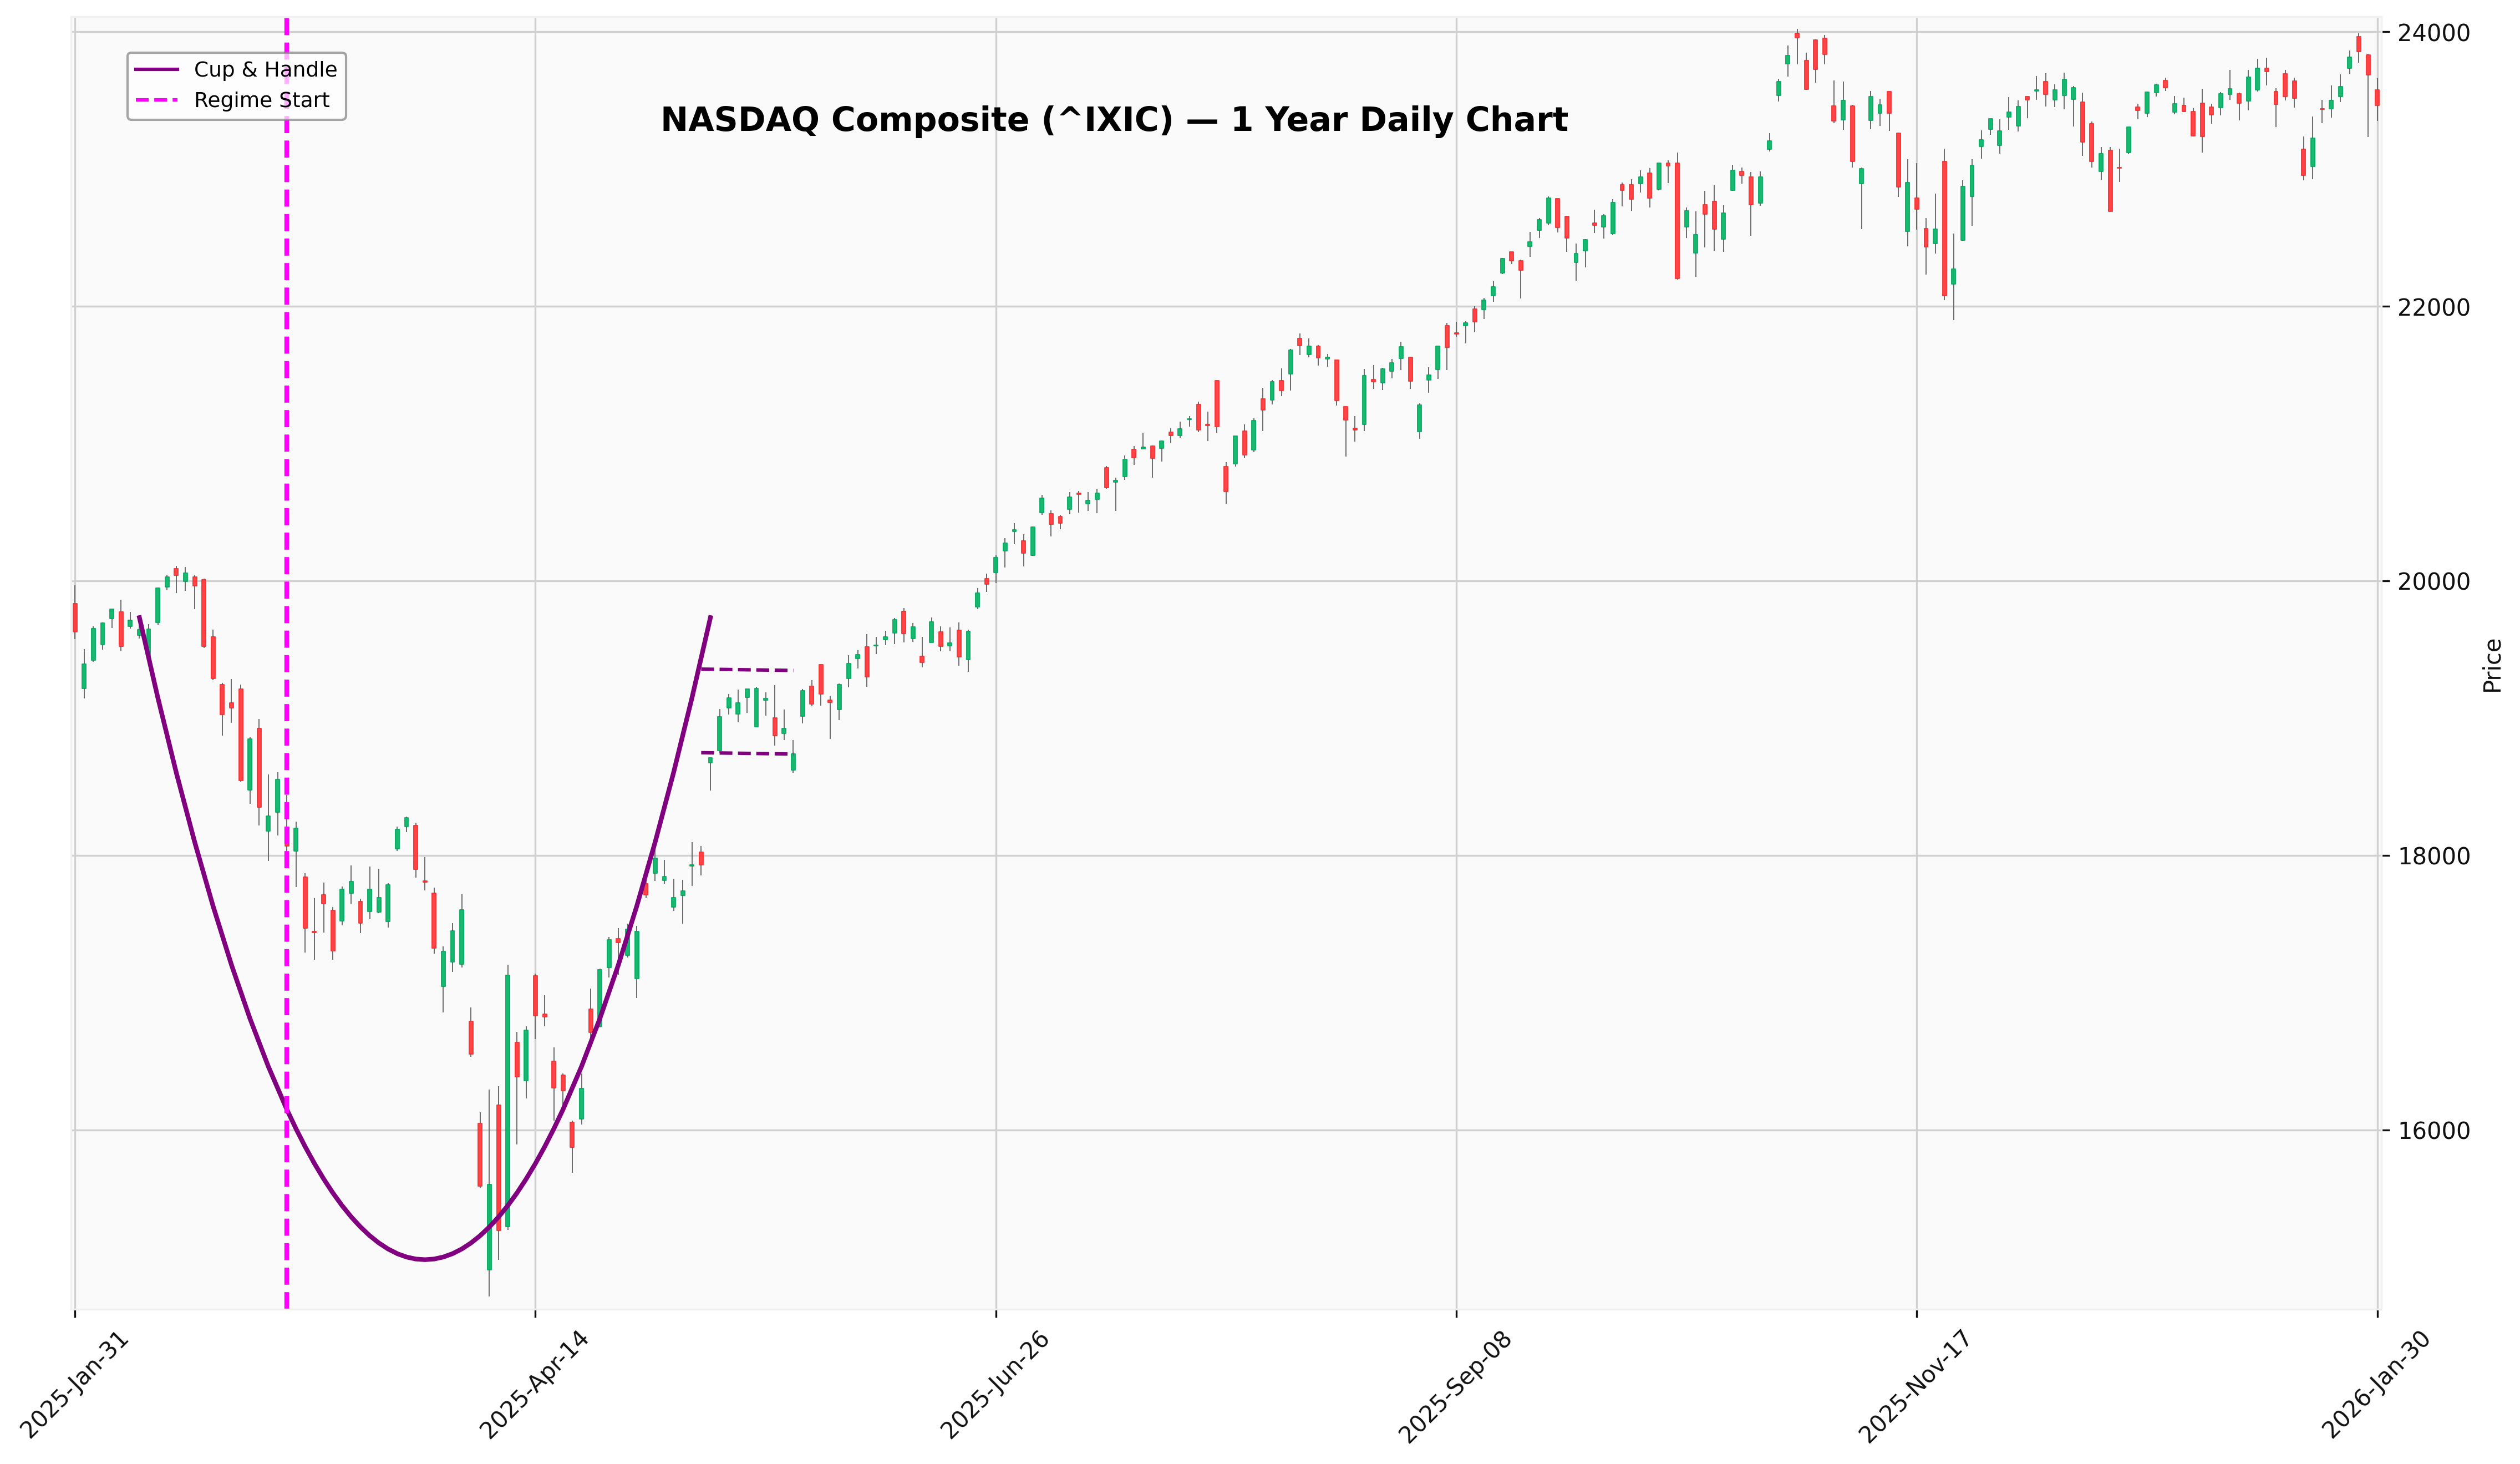
NASDAQ
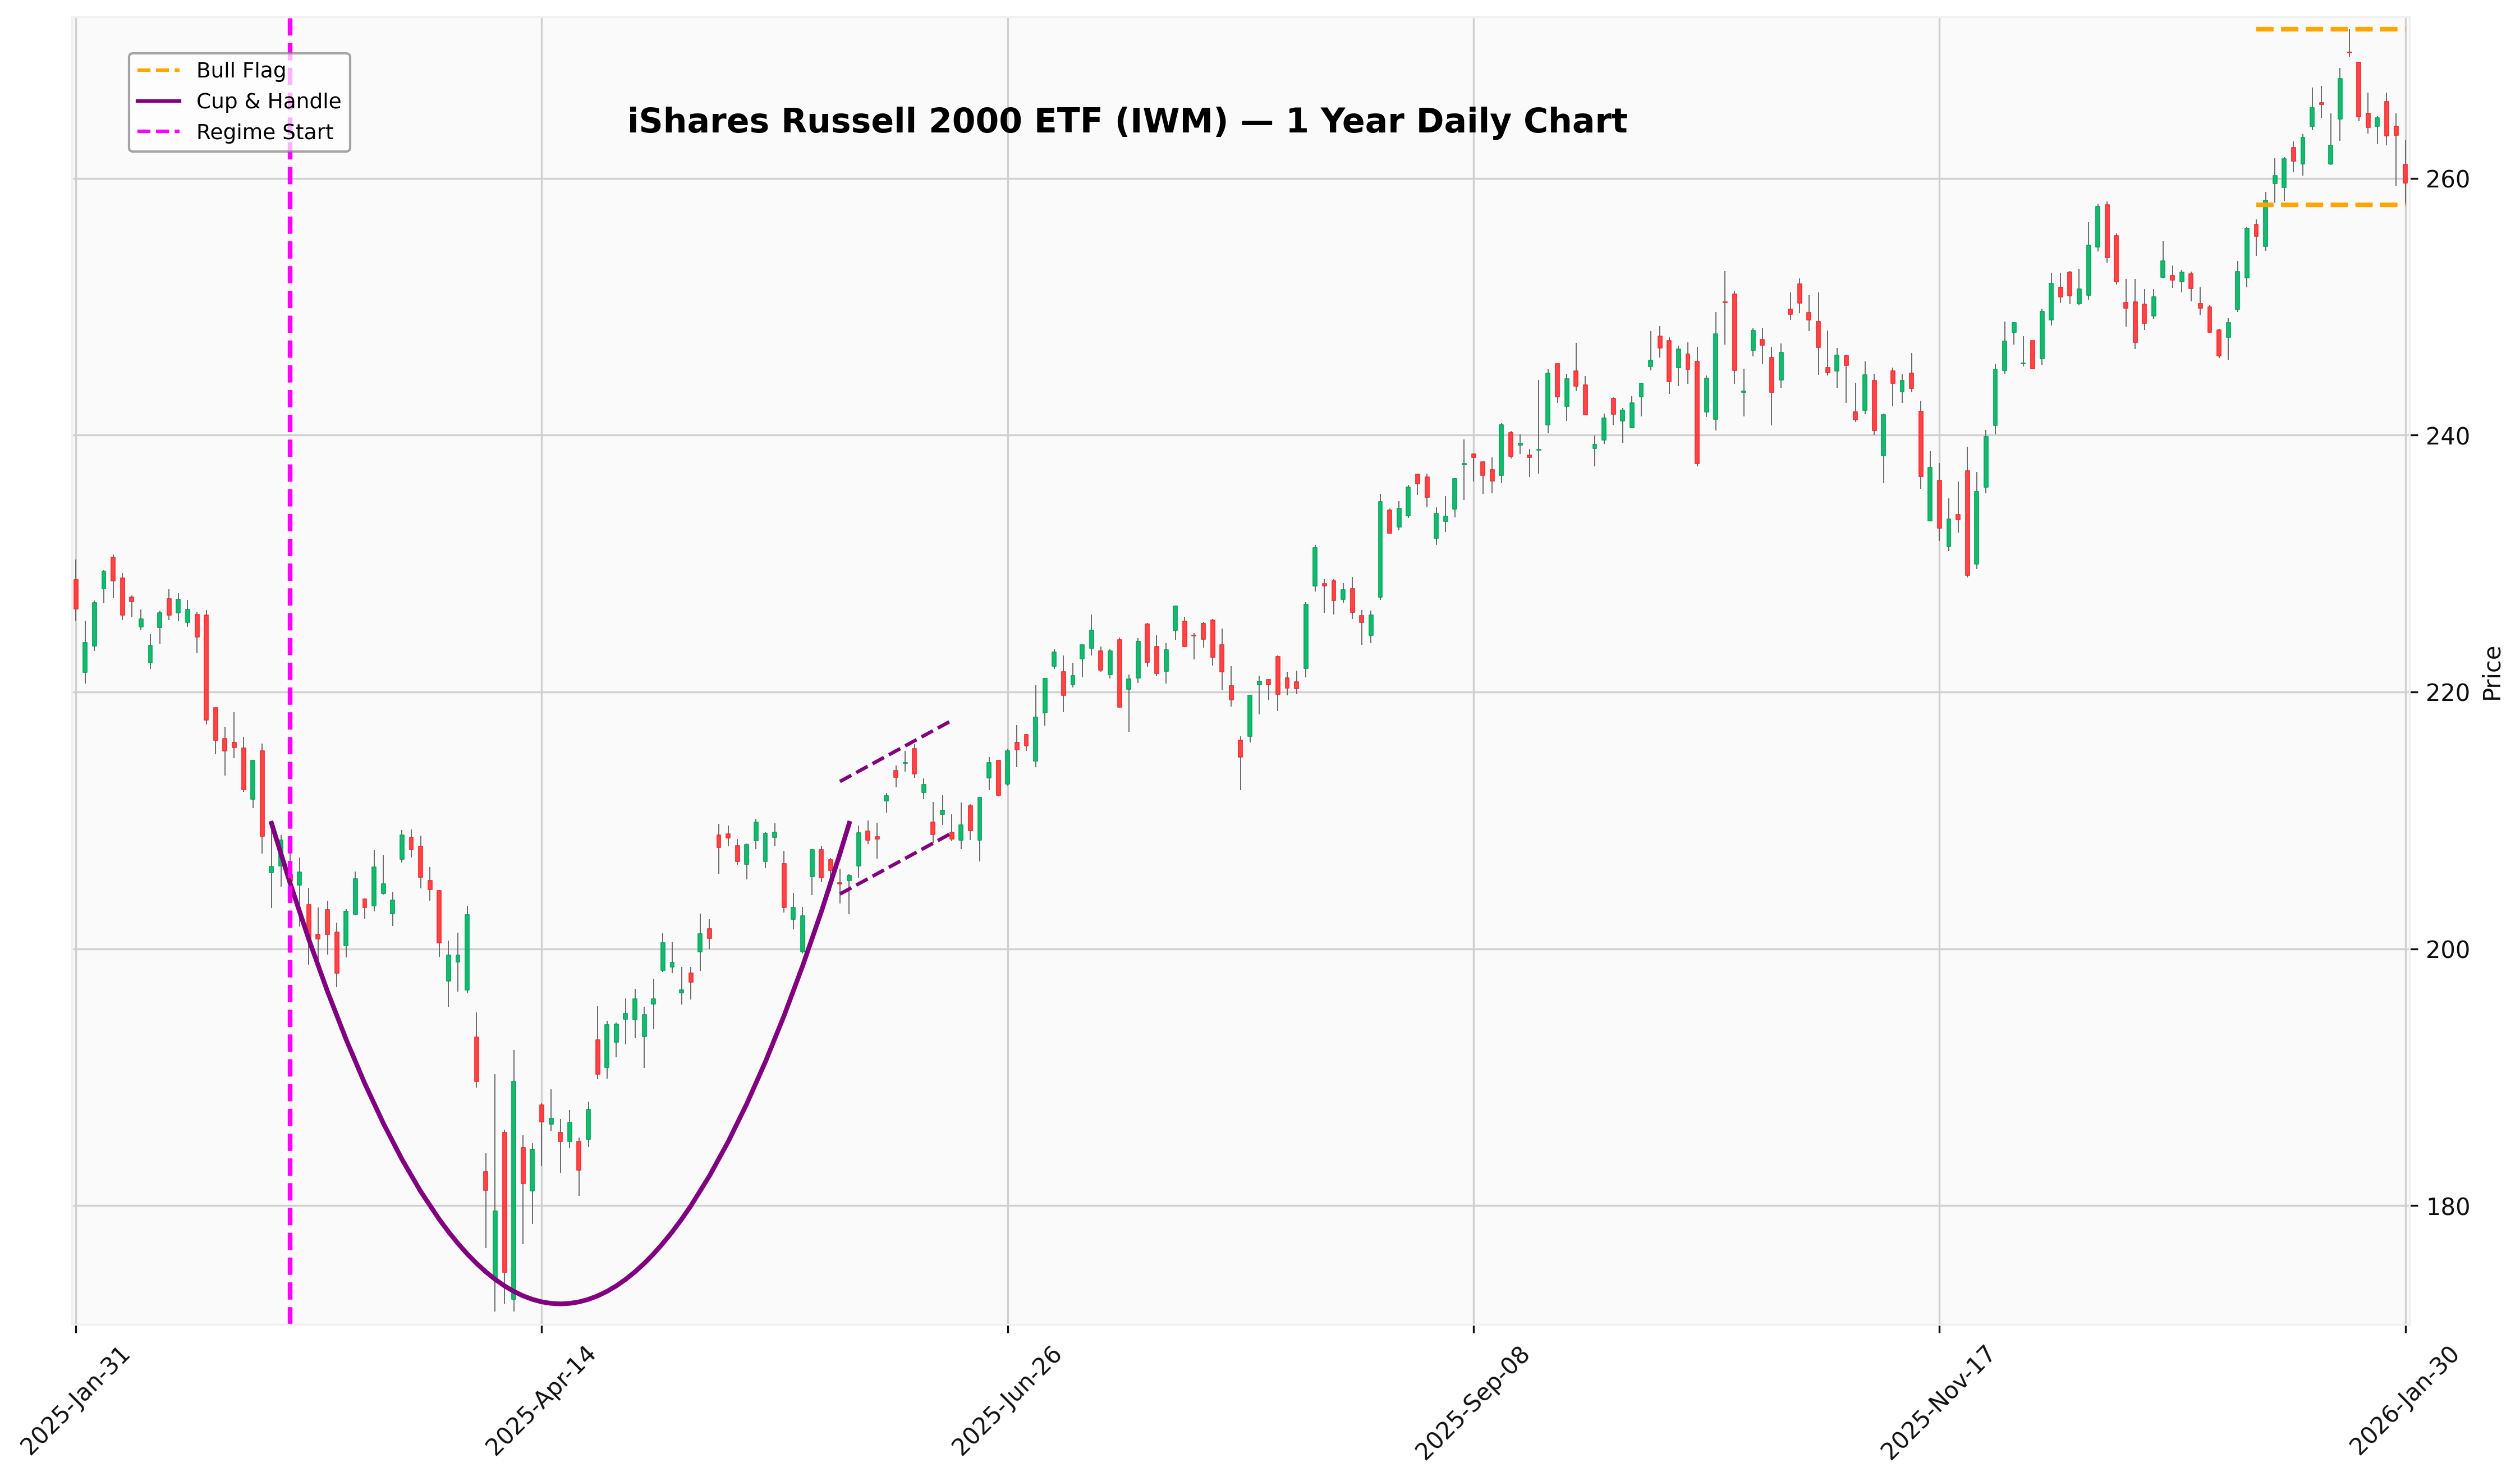
IWM
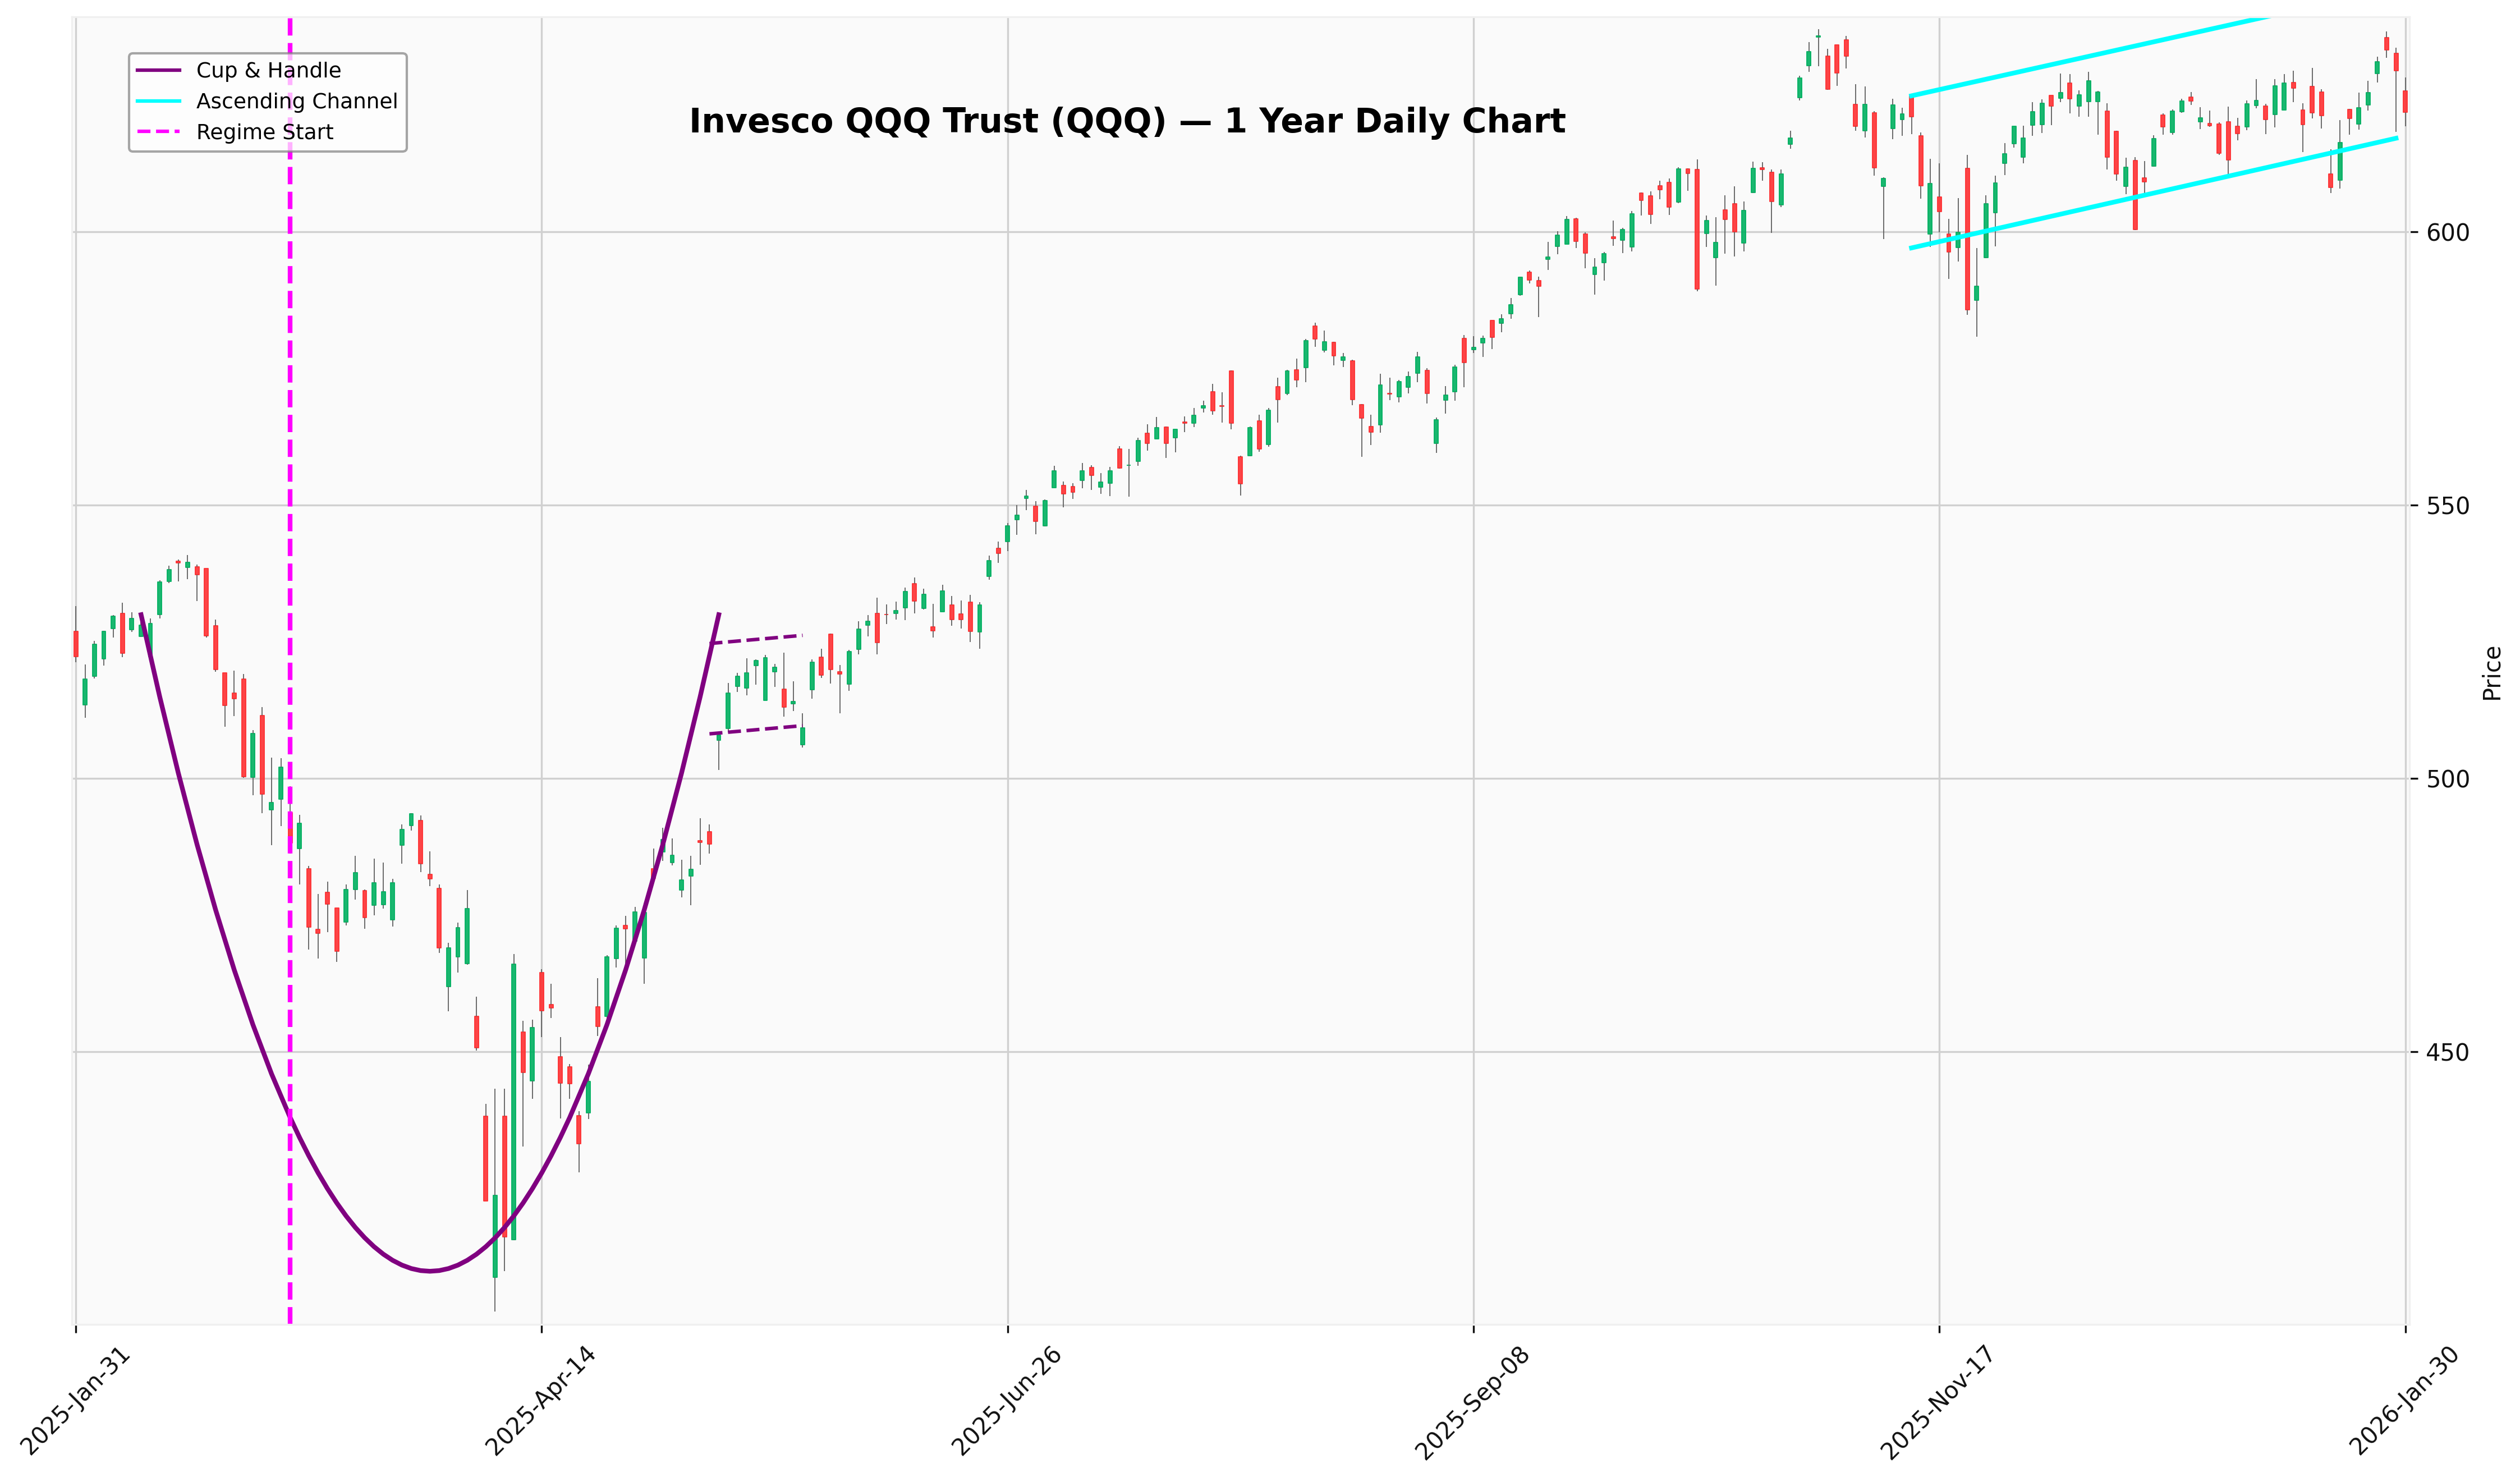
QQQ
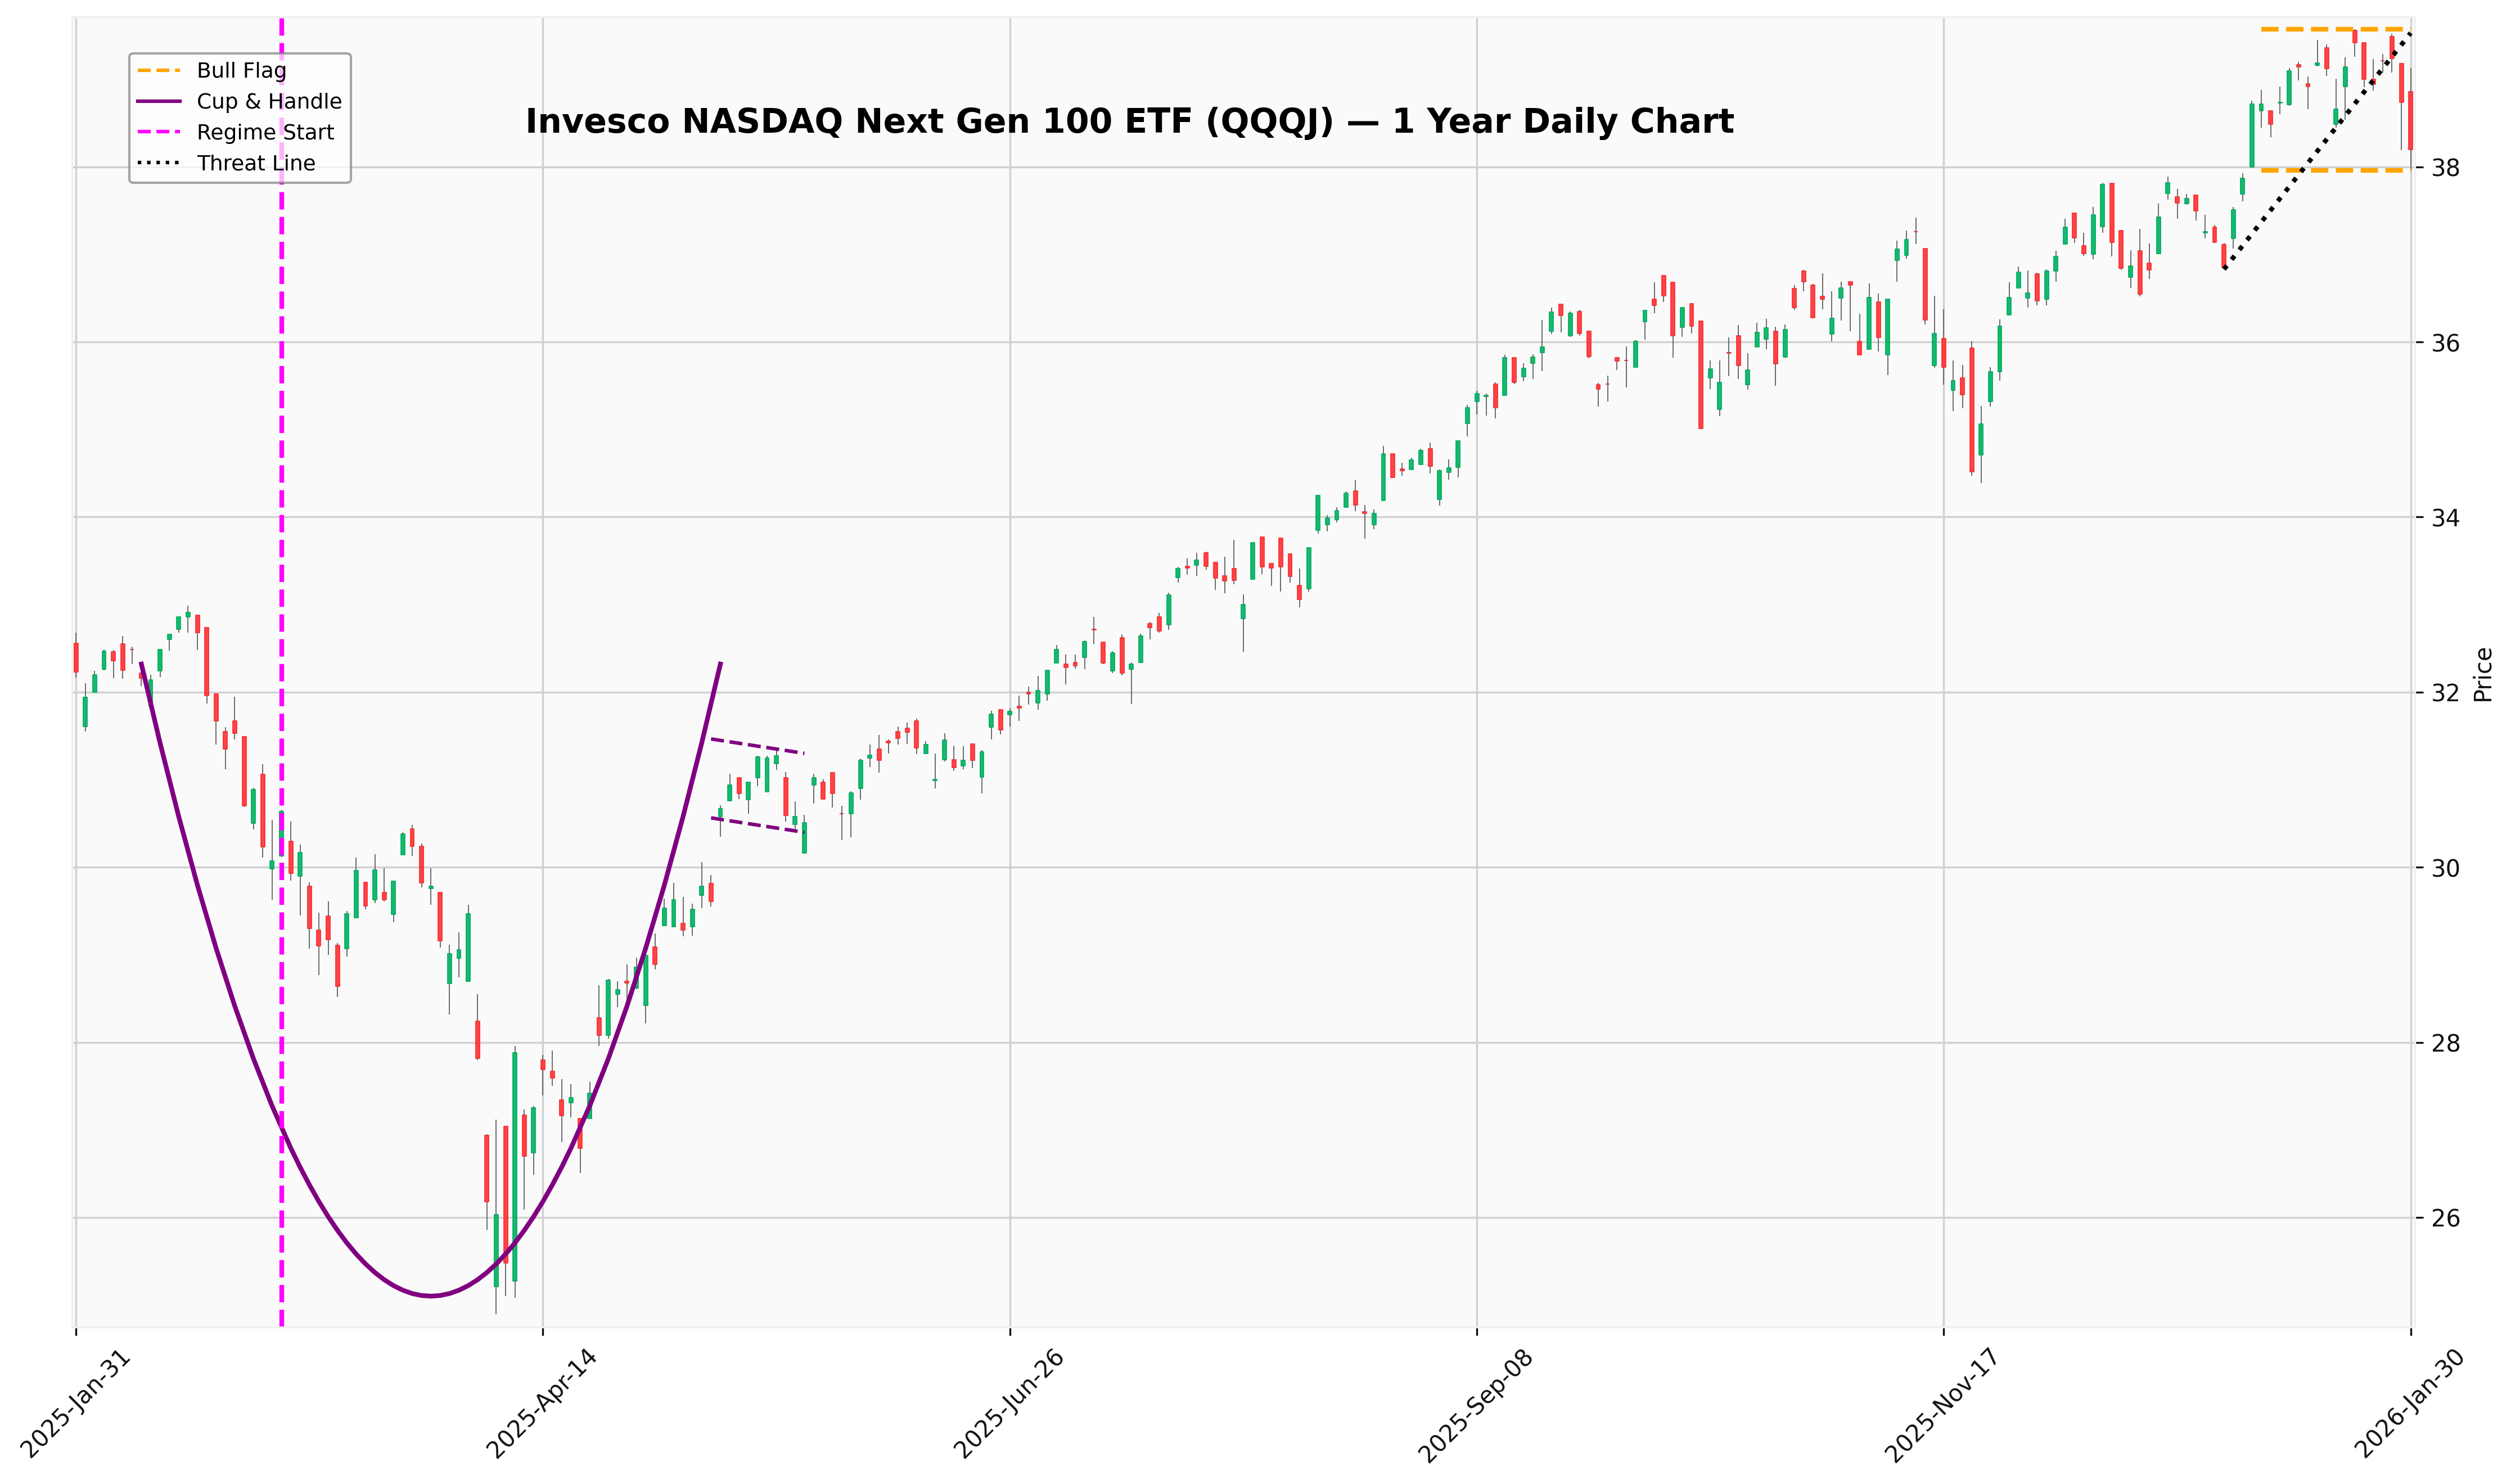
QQQJ- the juniors

PHLX Semiconductor
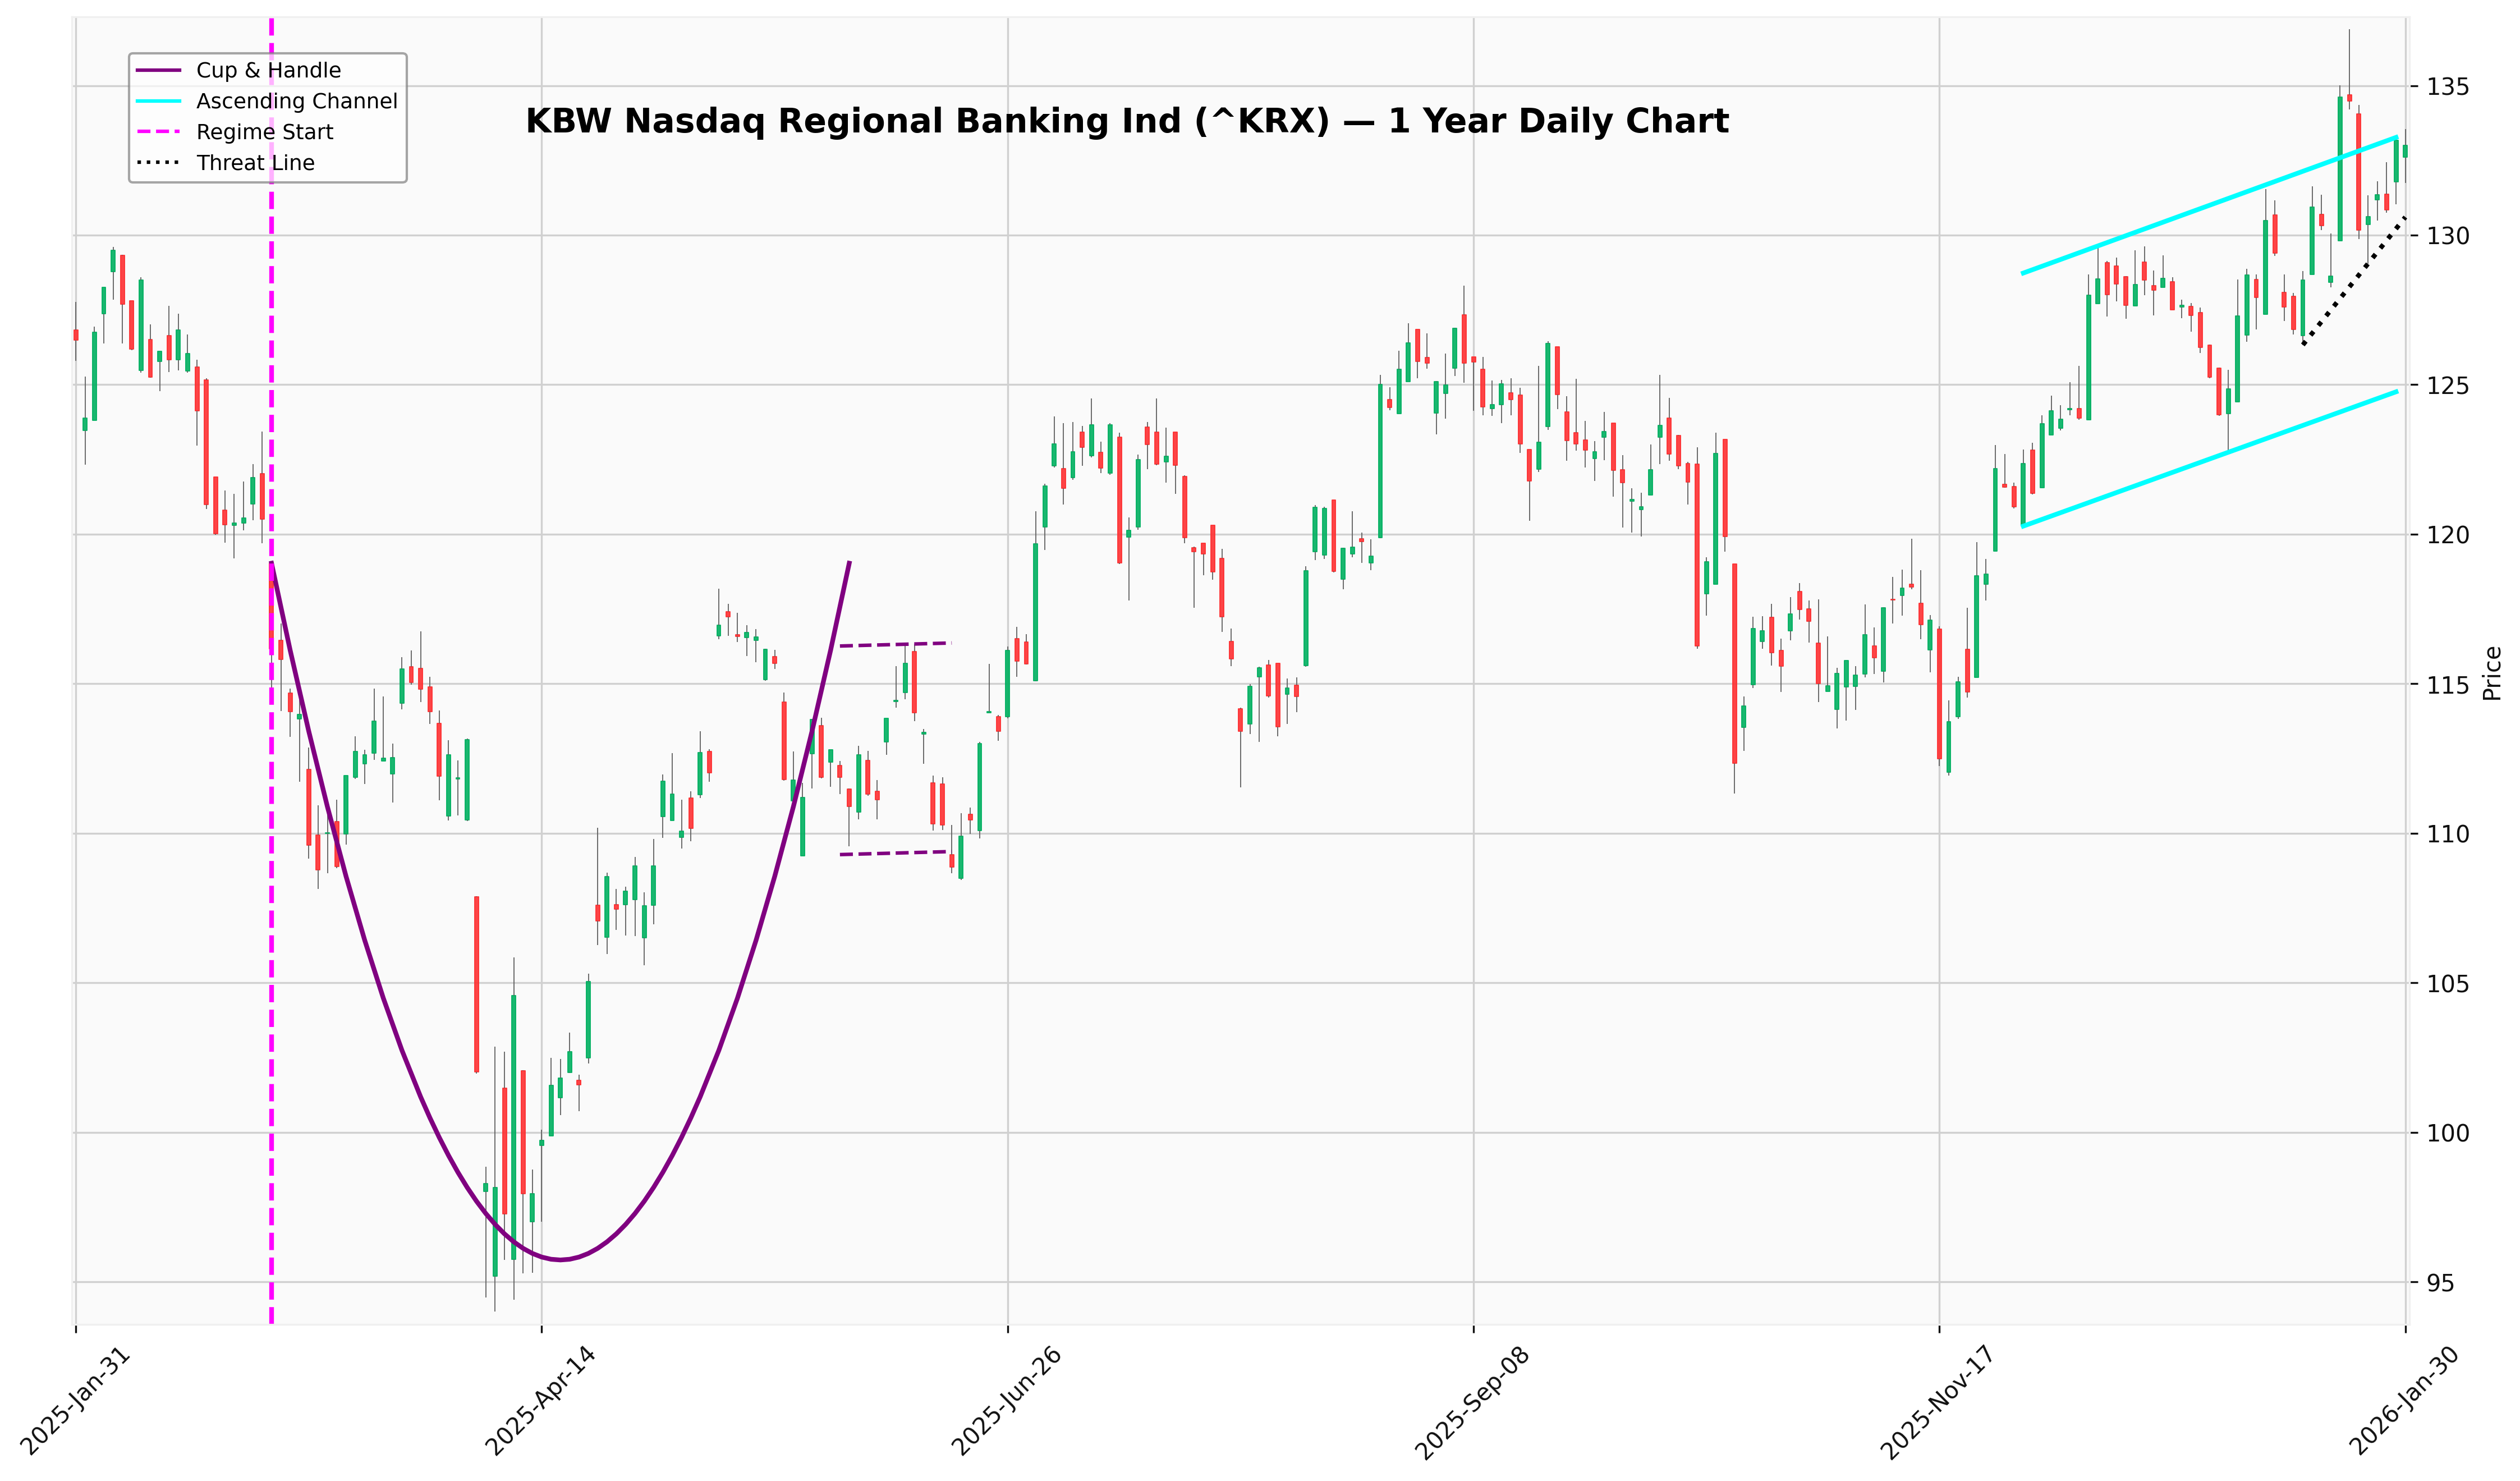
KBW BANK index
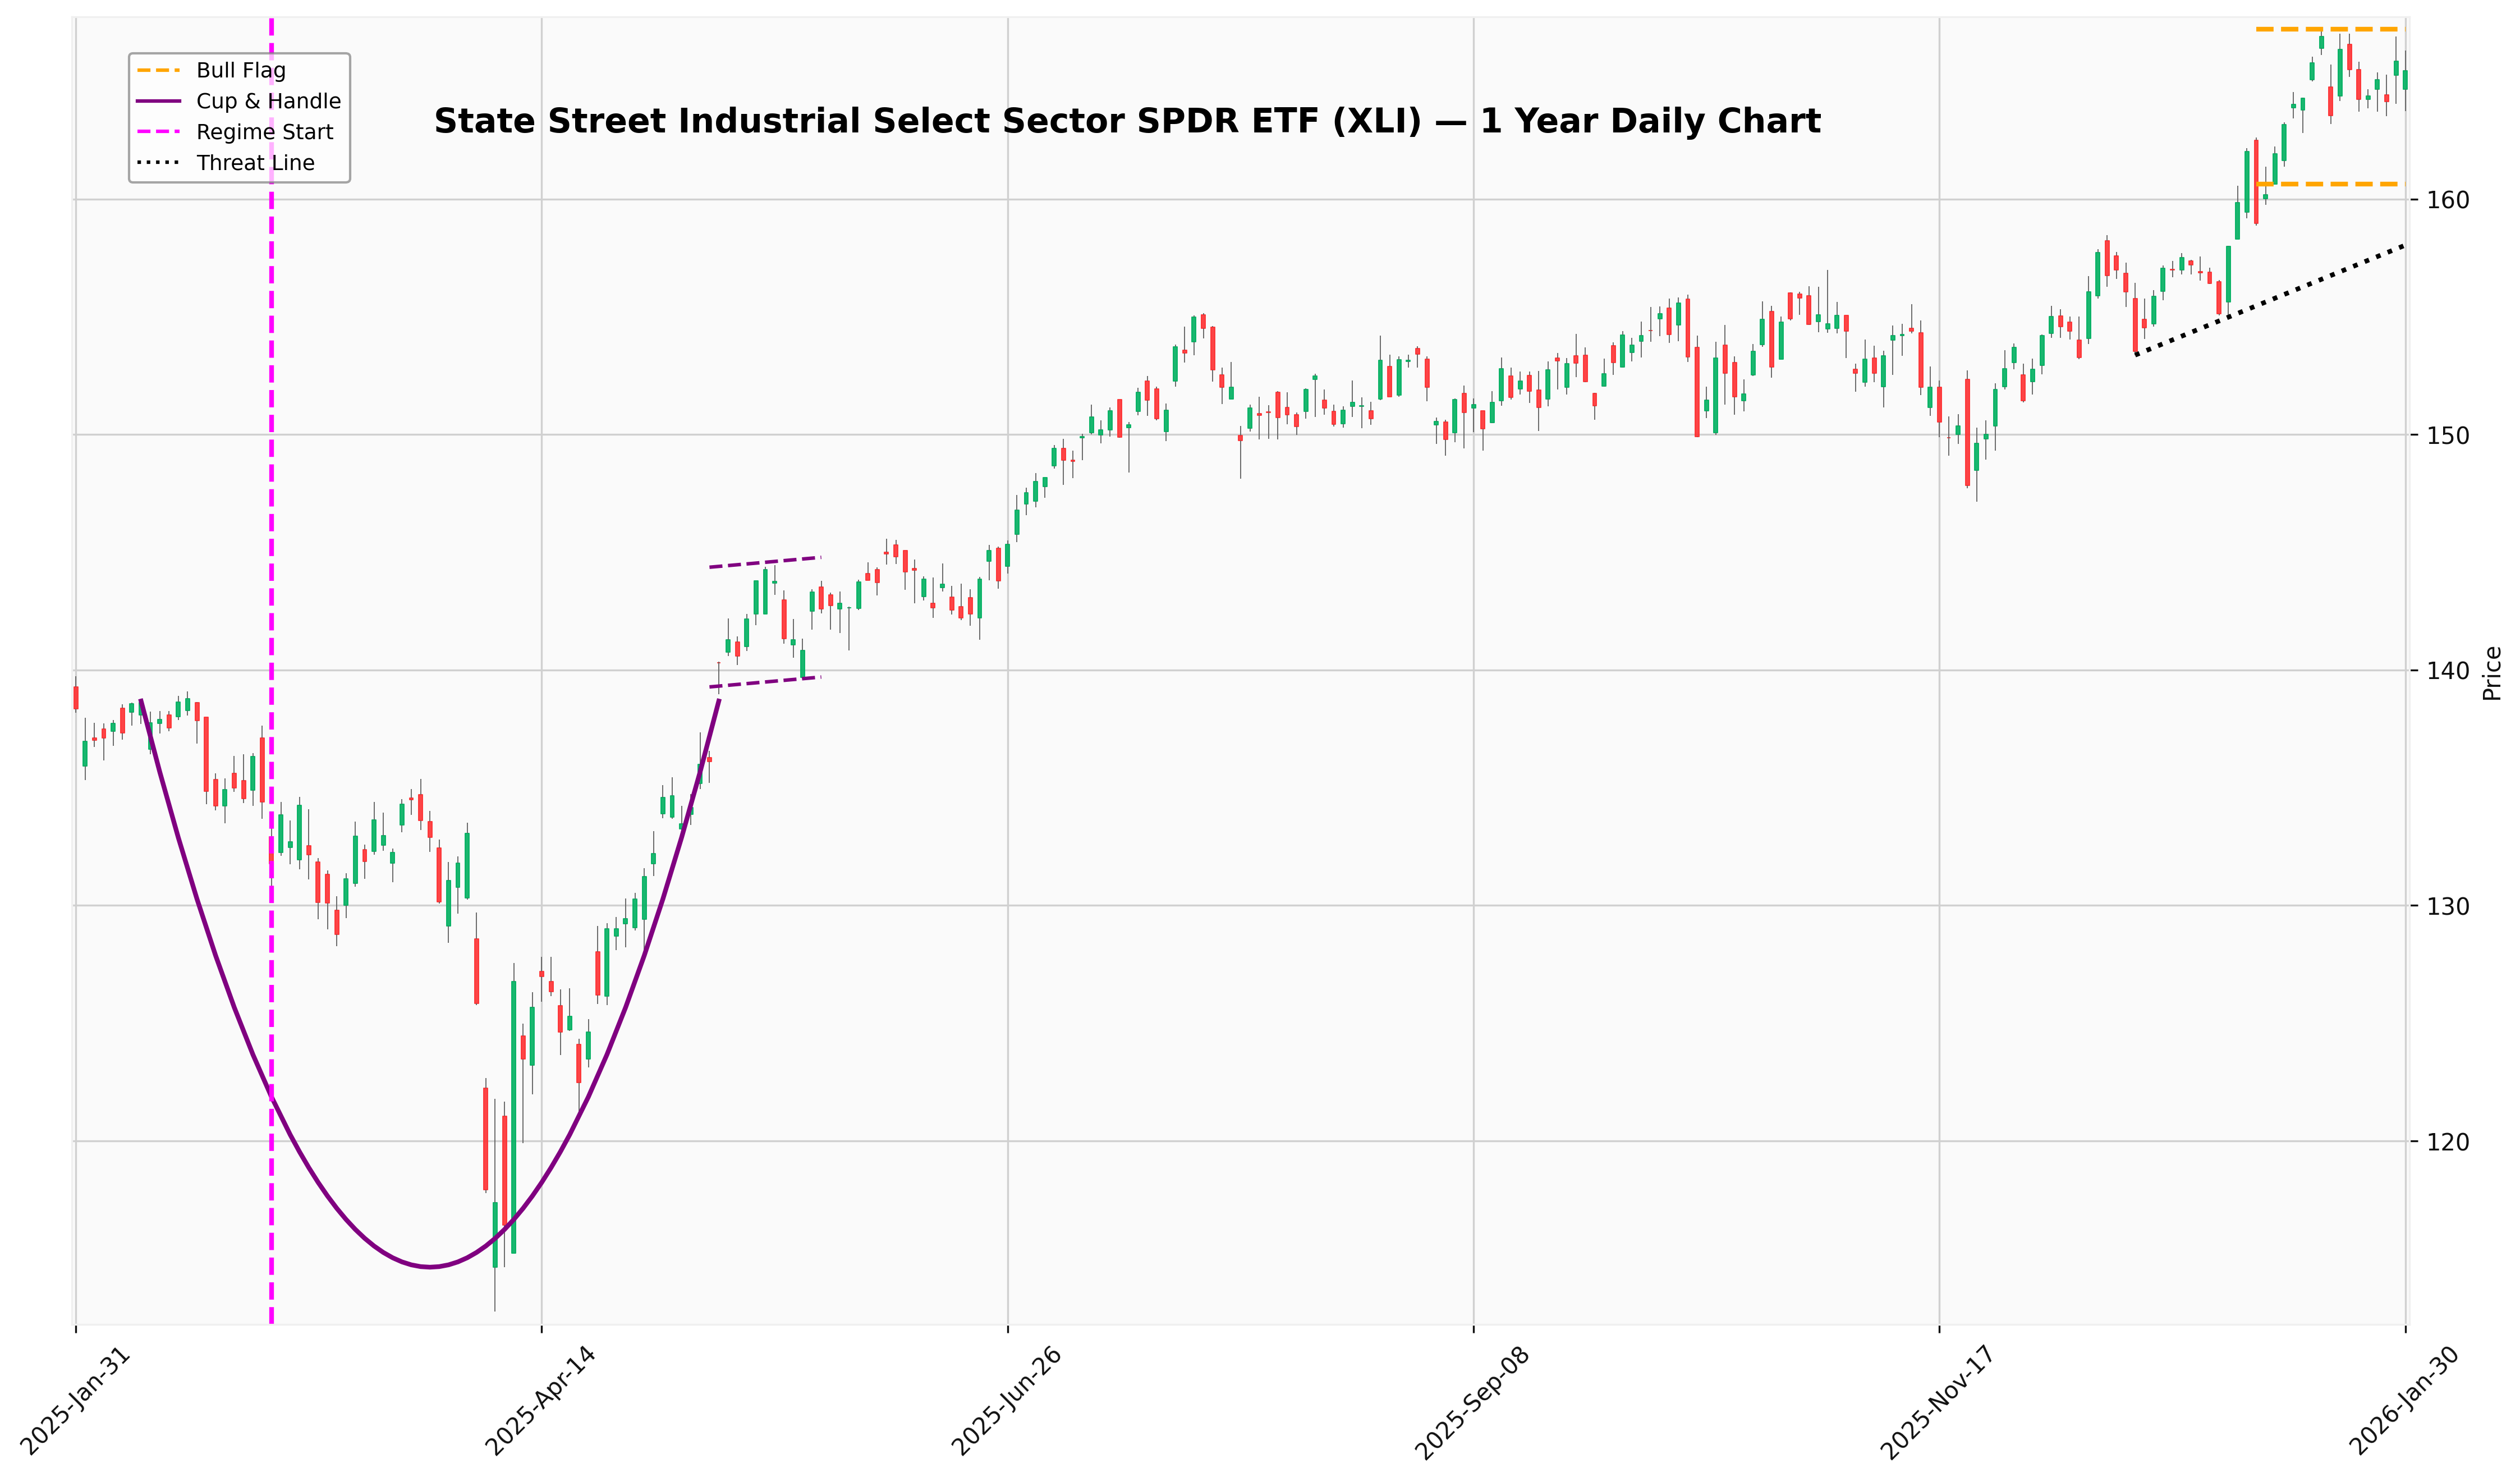
Industrial Select
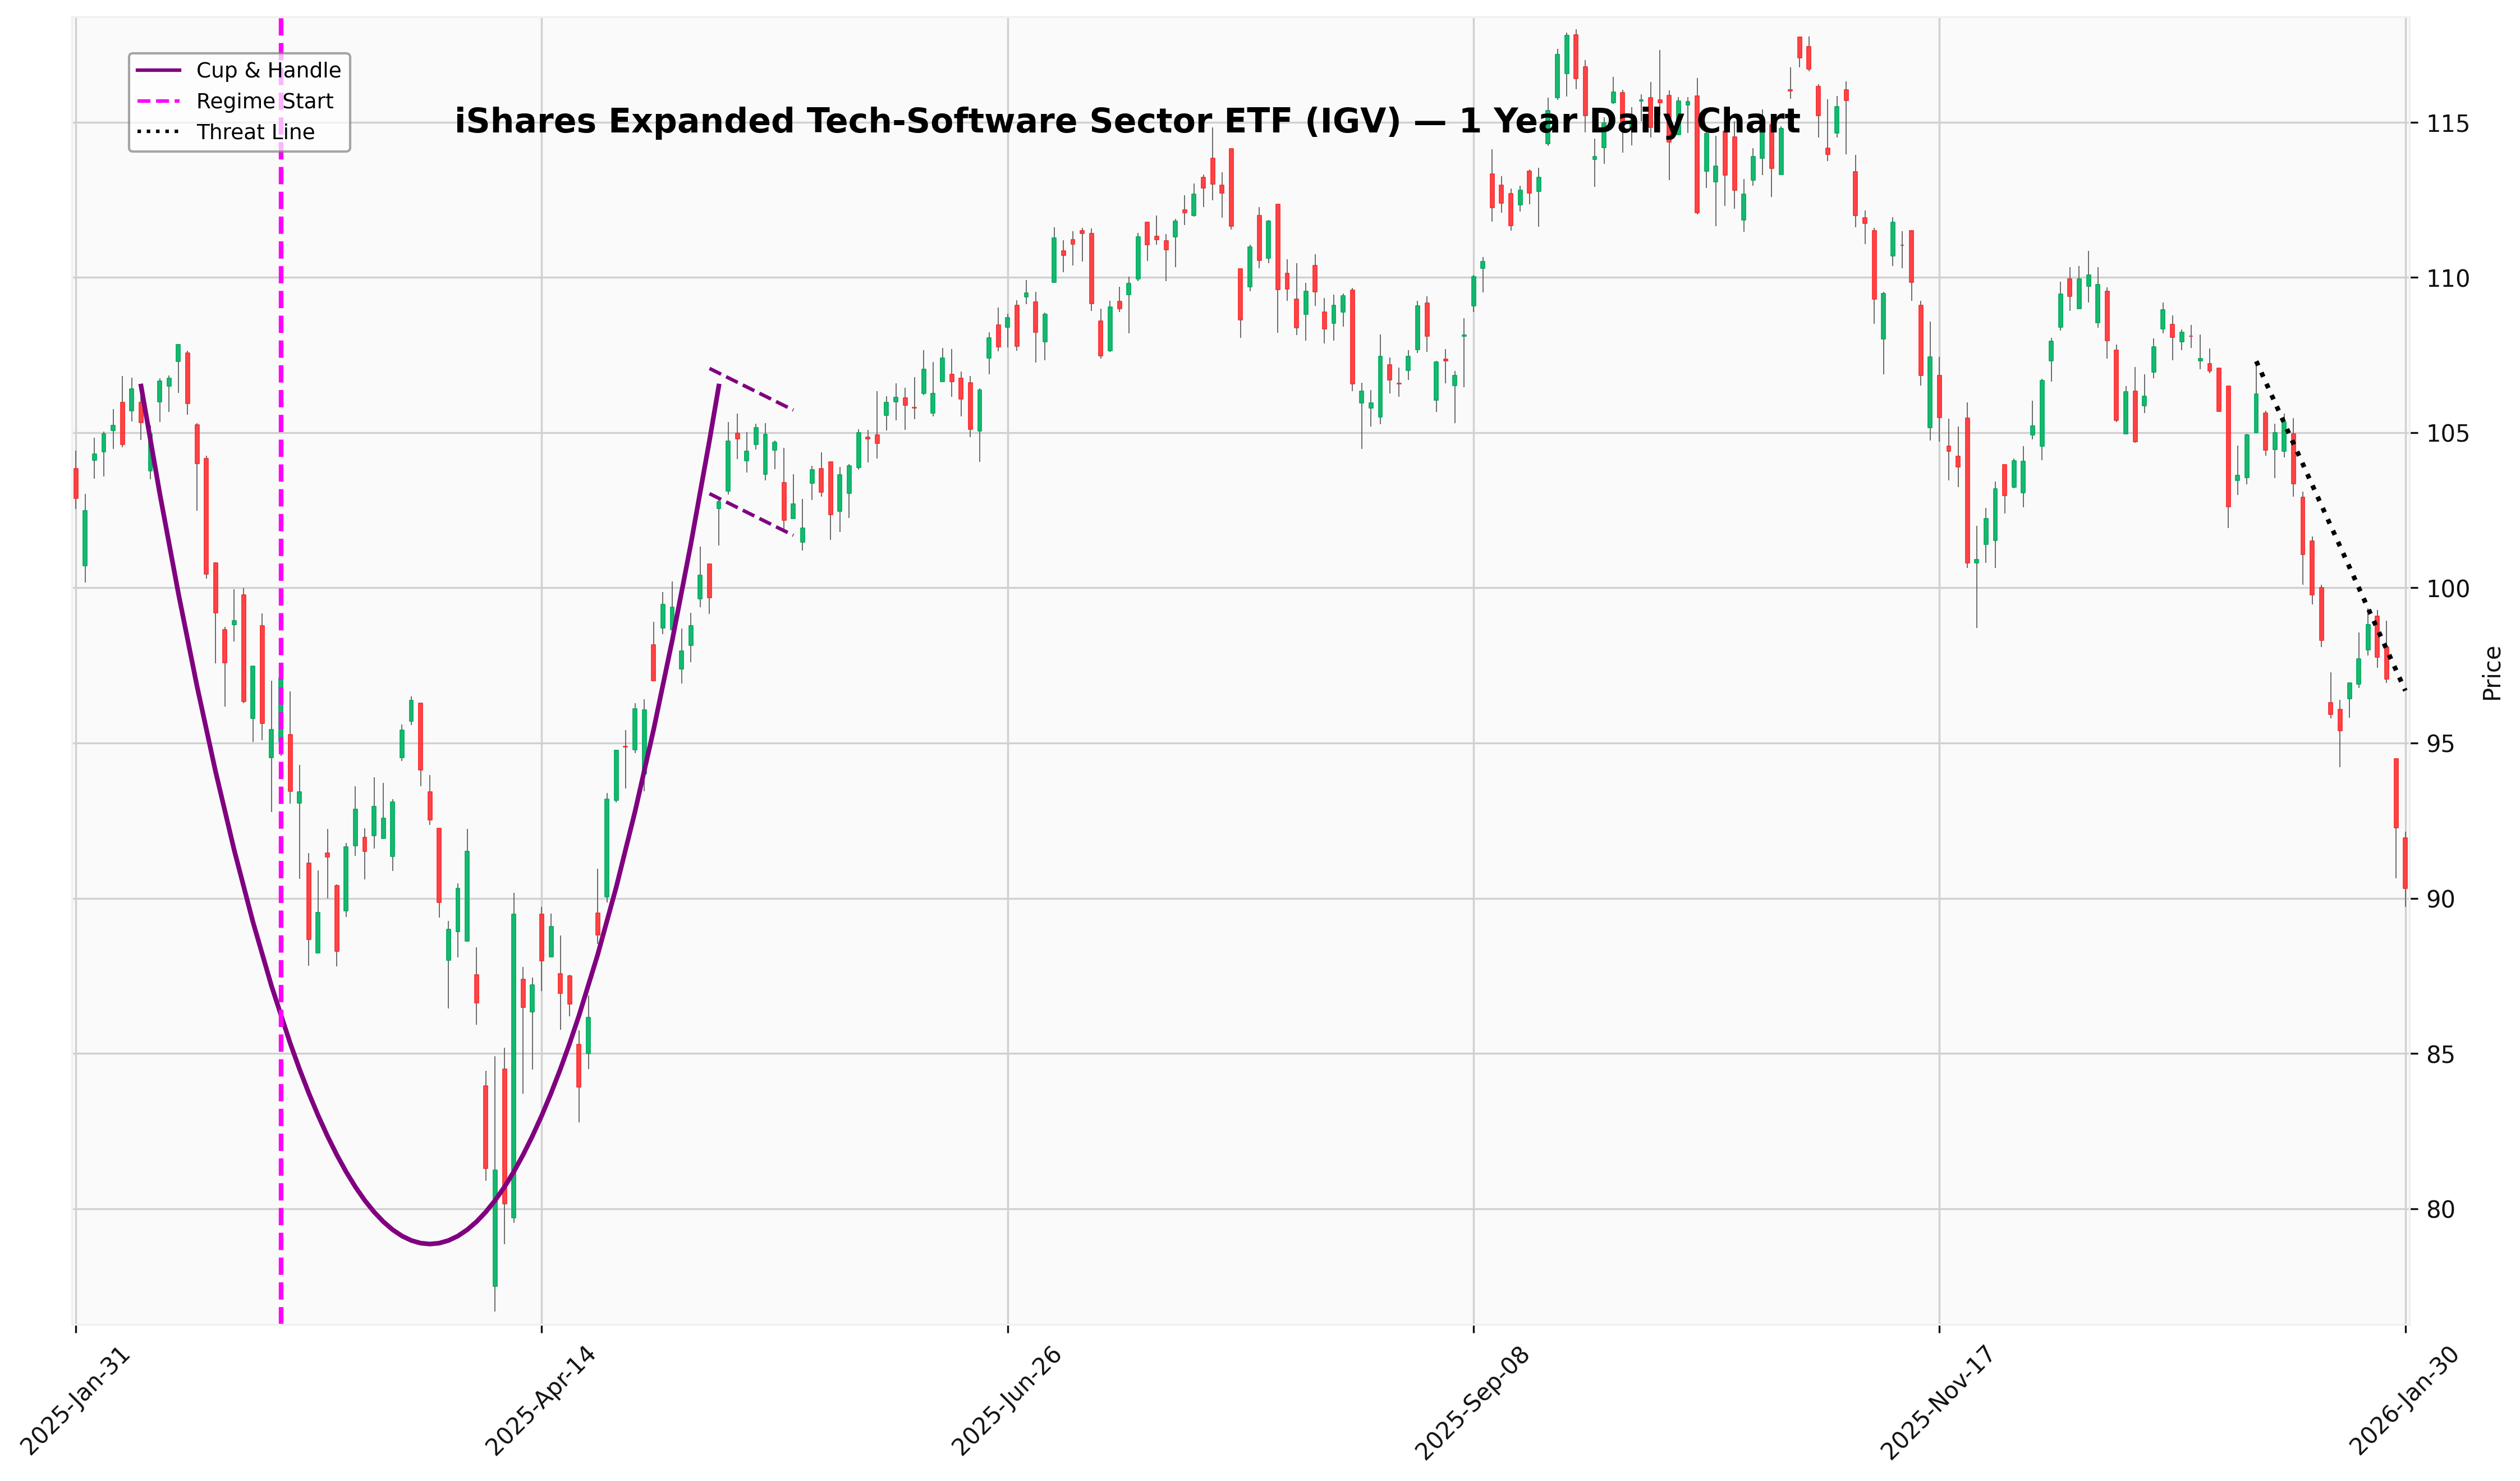
Tech-Software Sector
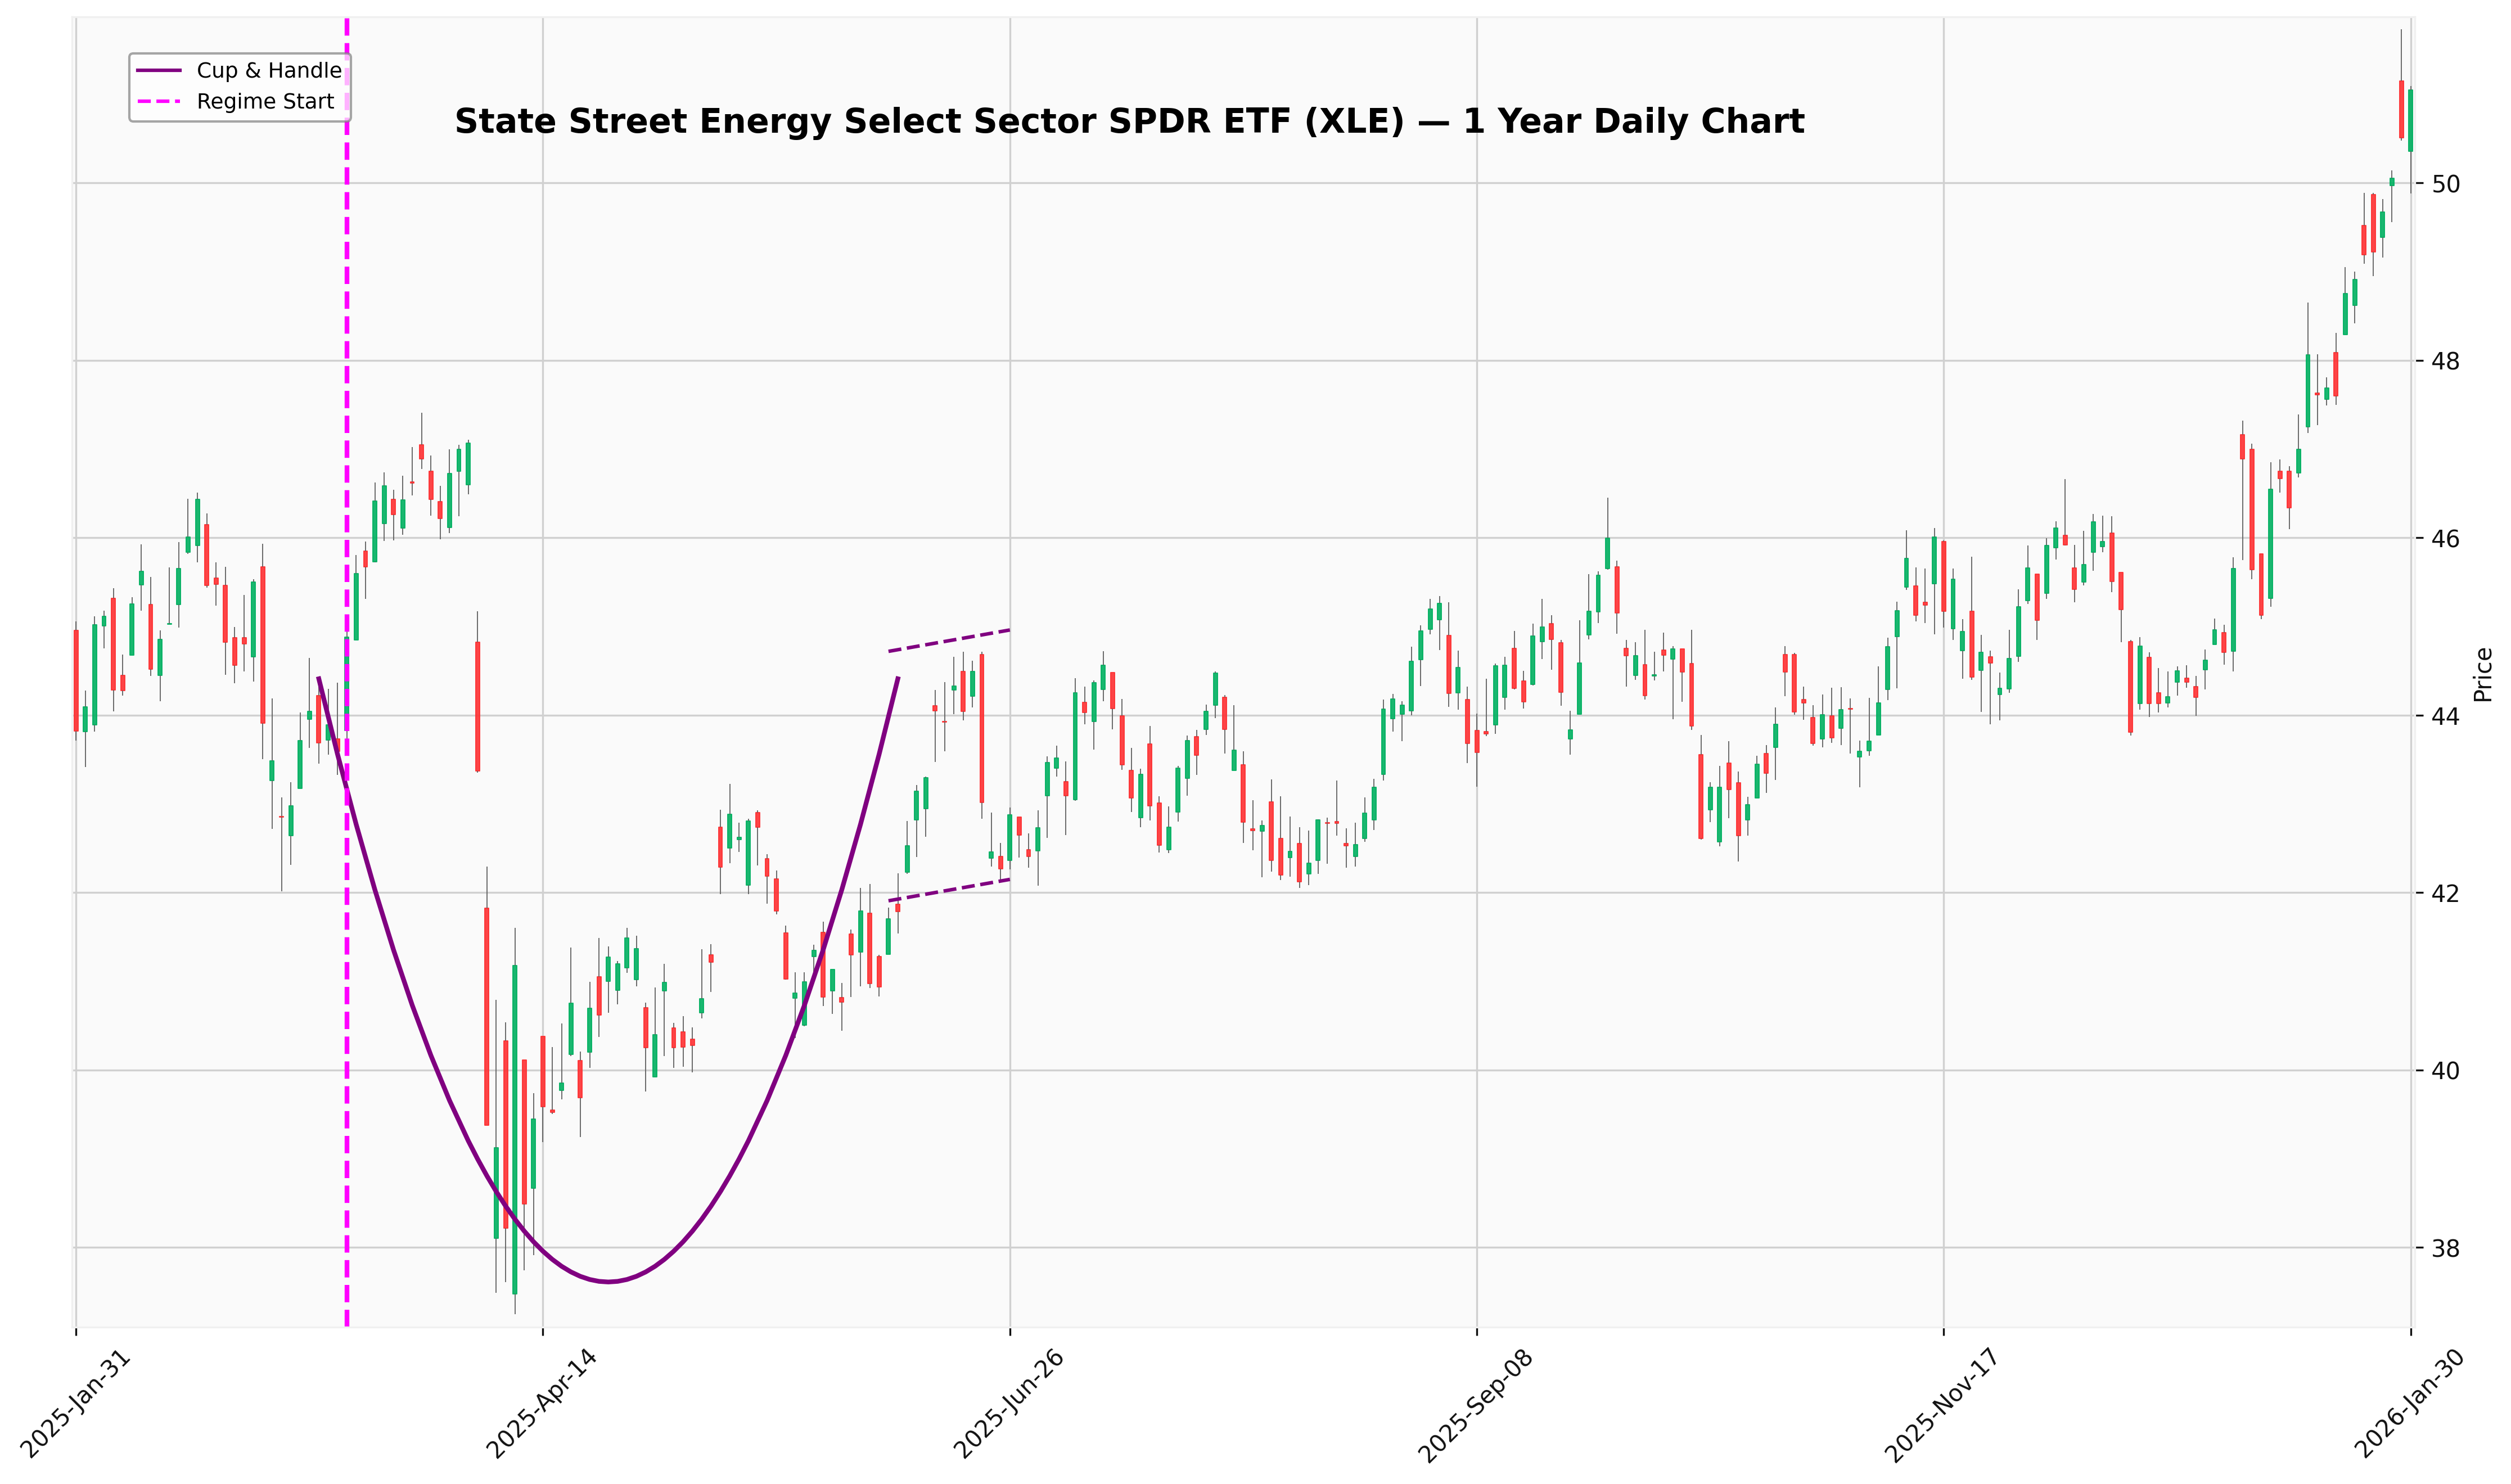
Energy Select Sector
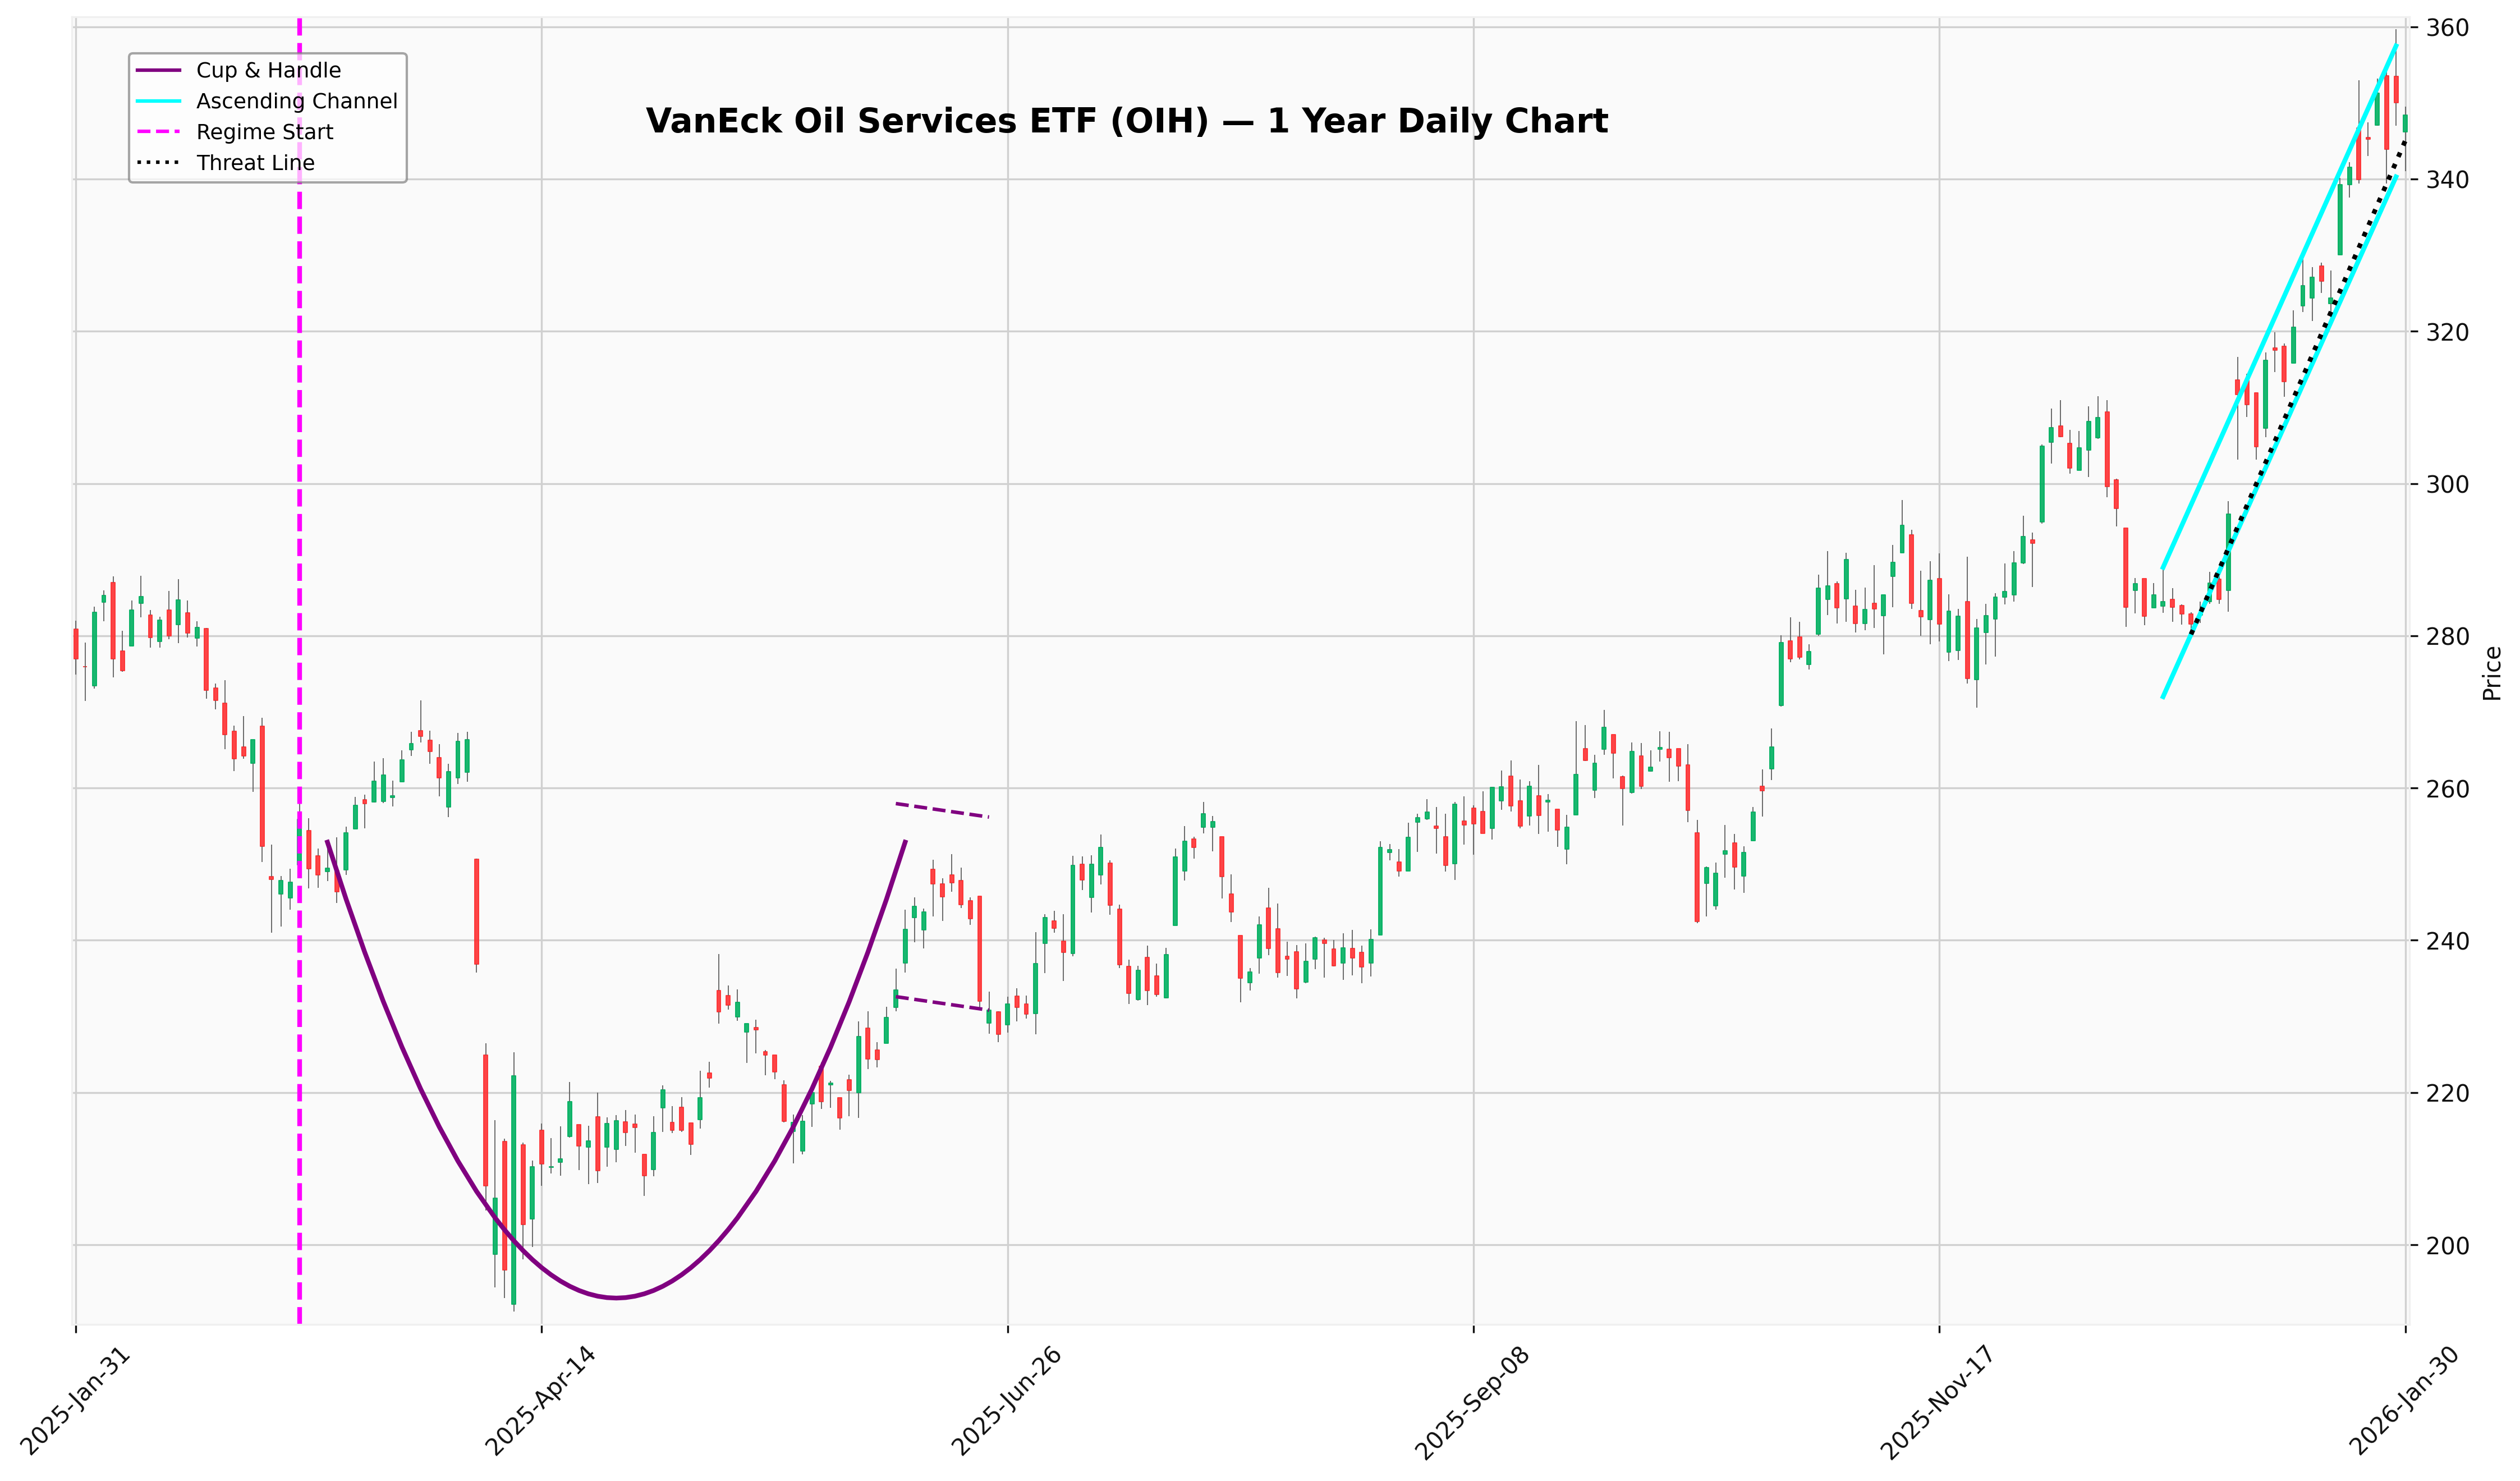
VanEck Oil Services
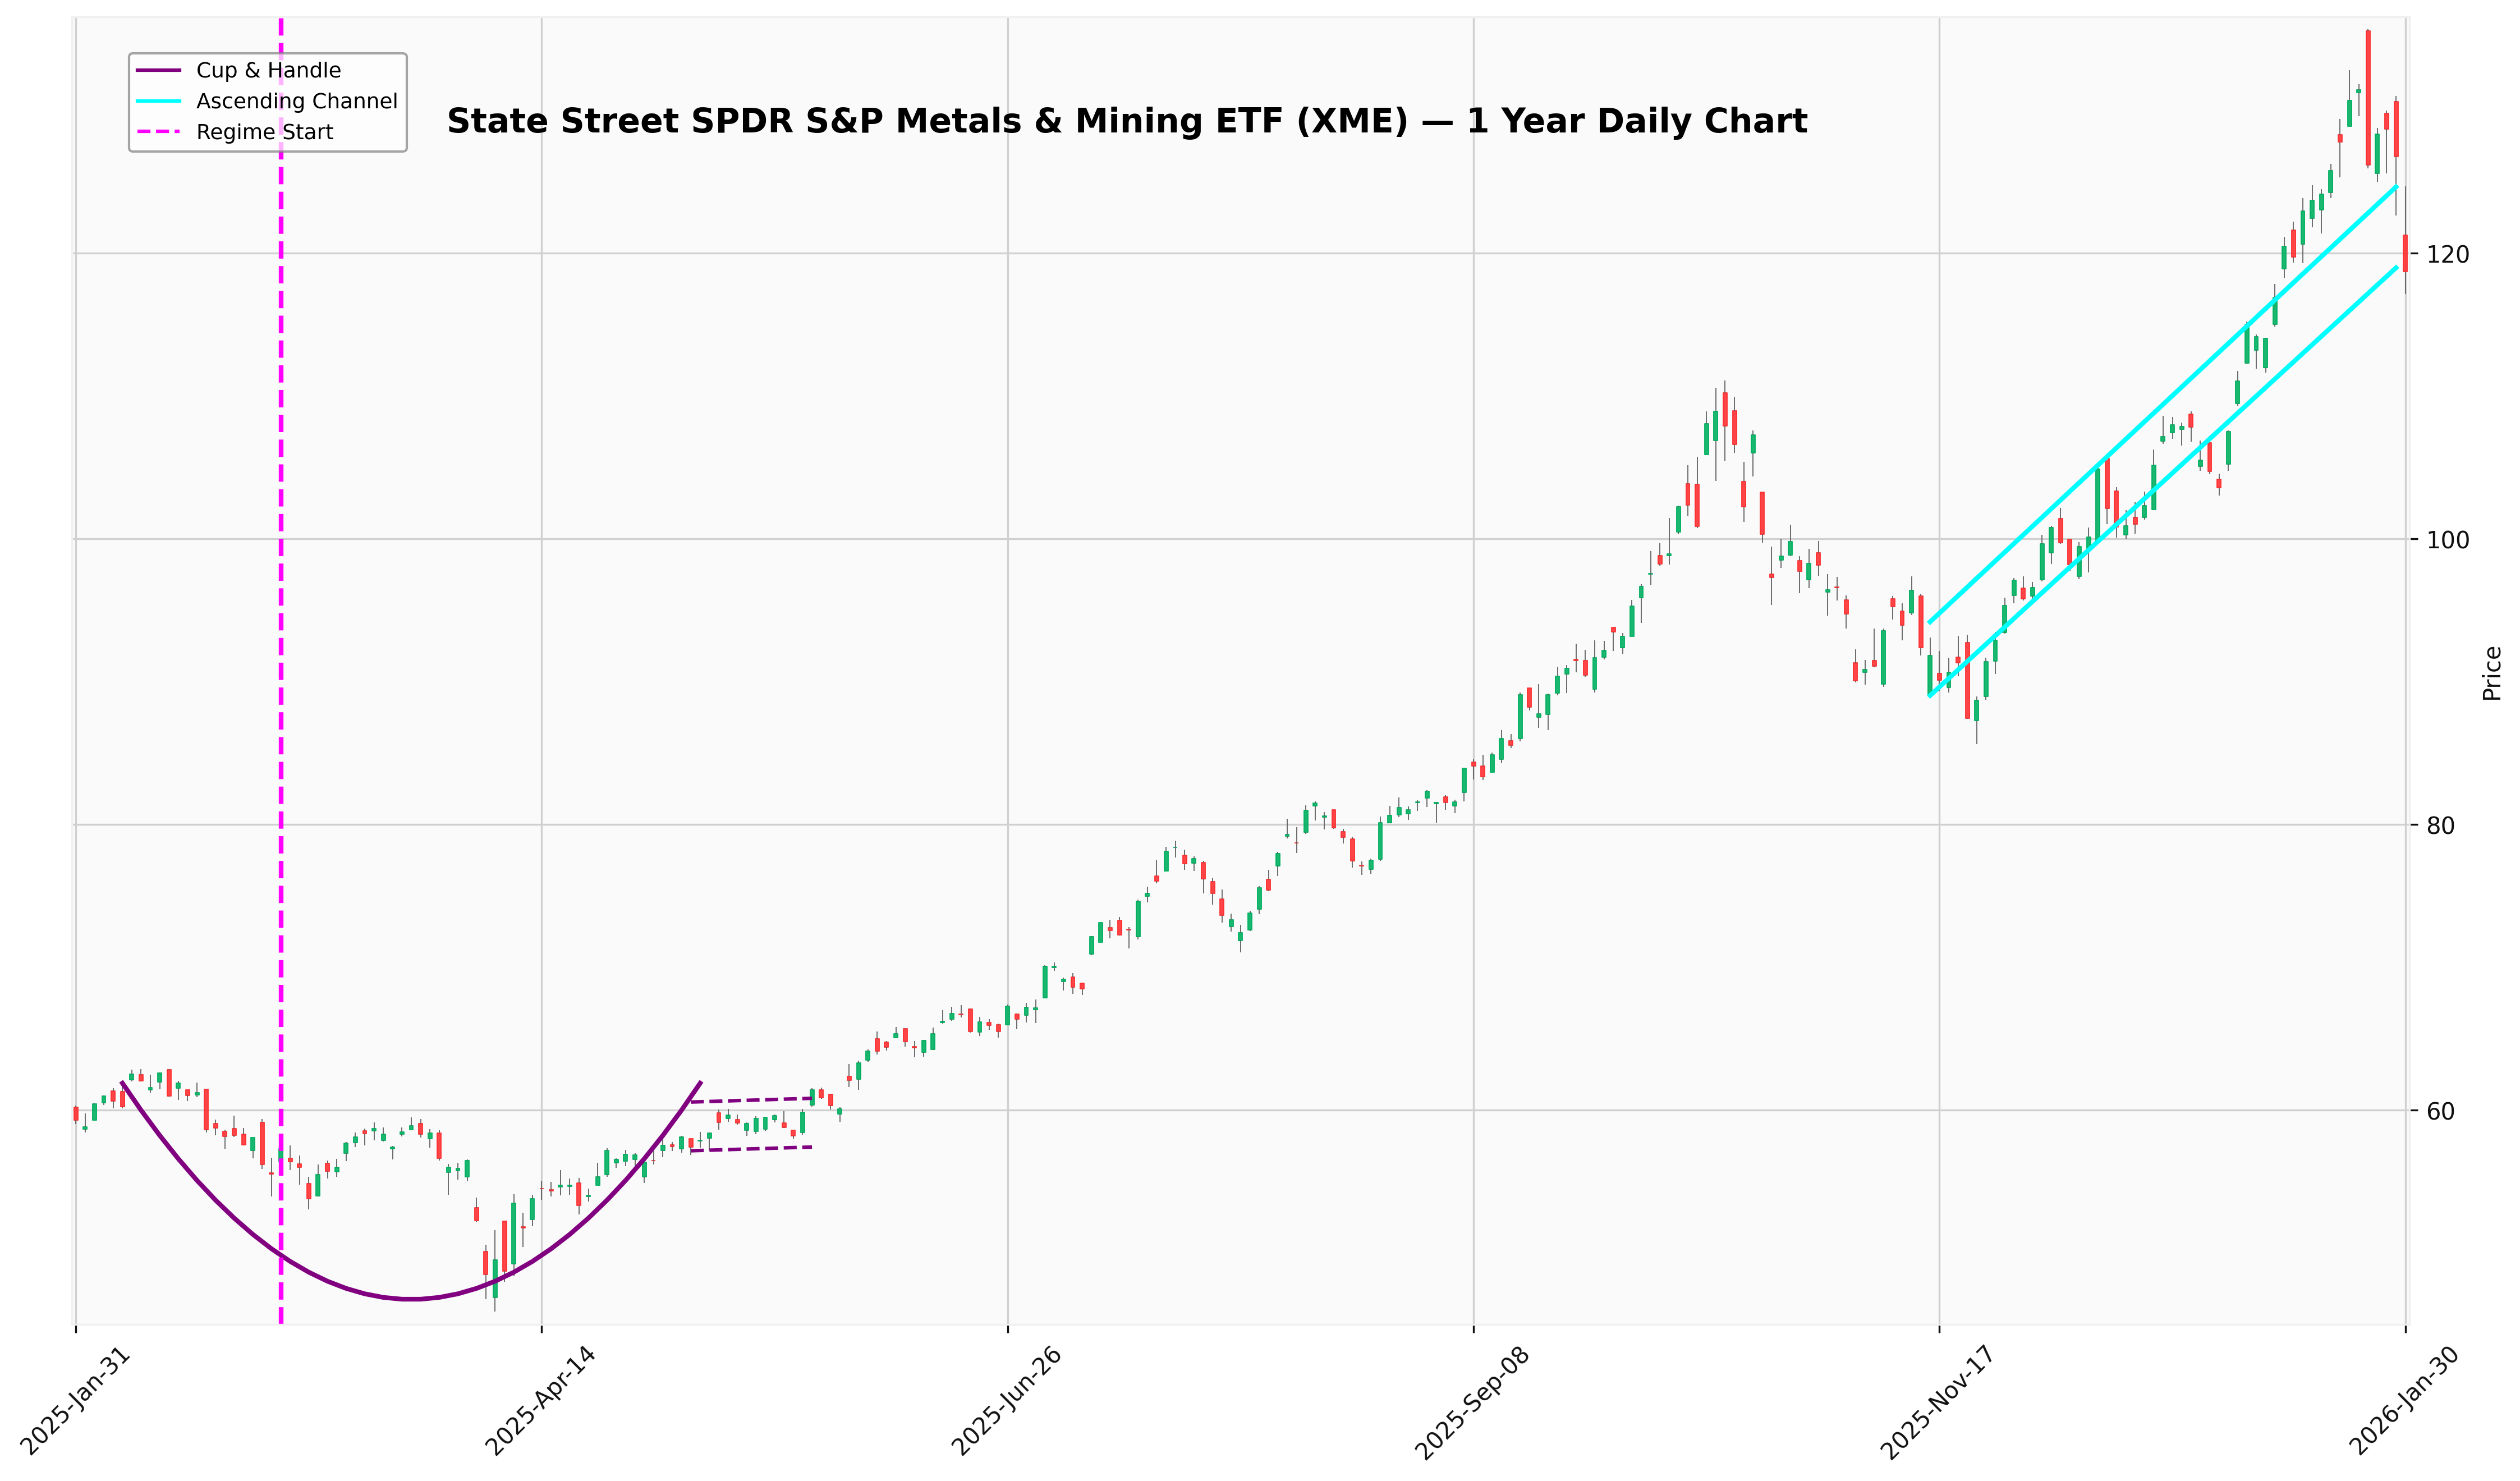
Metals & Mining
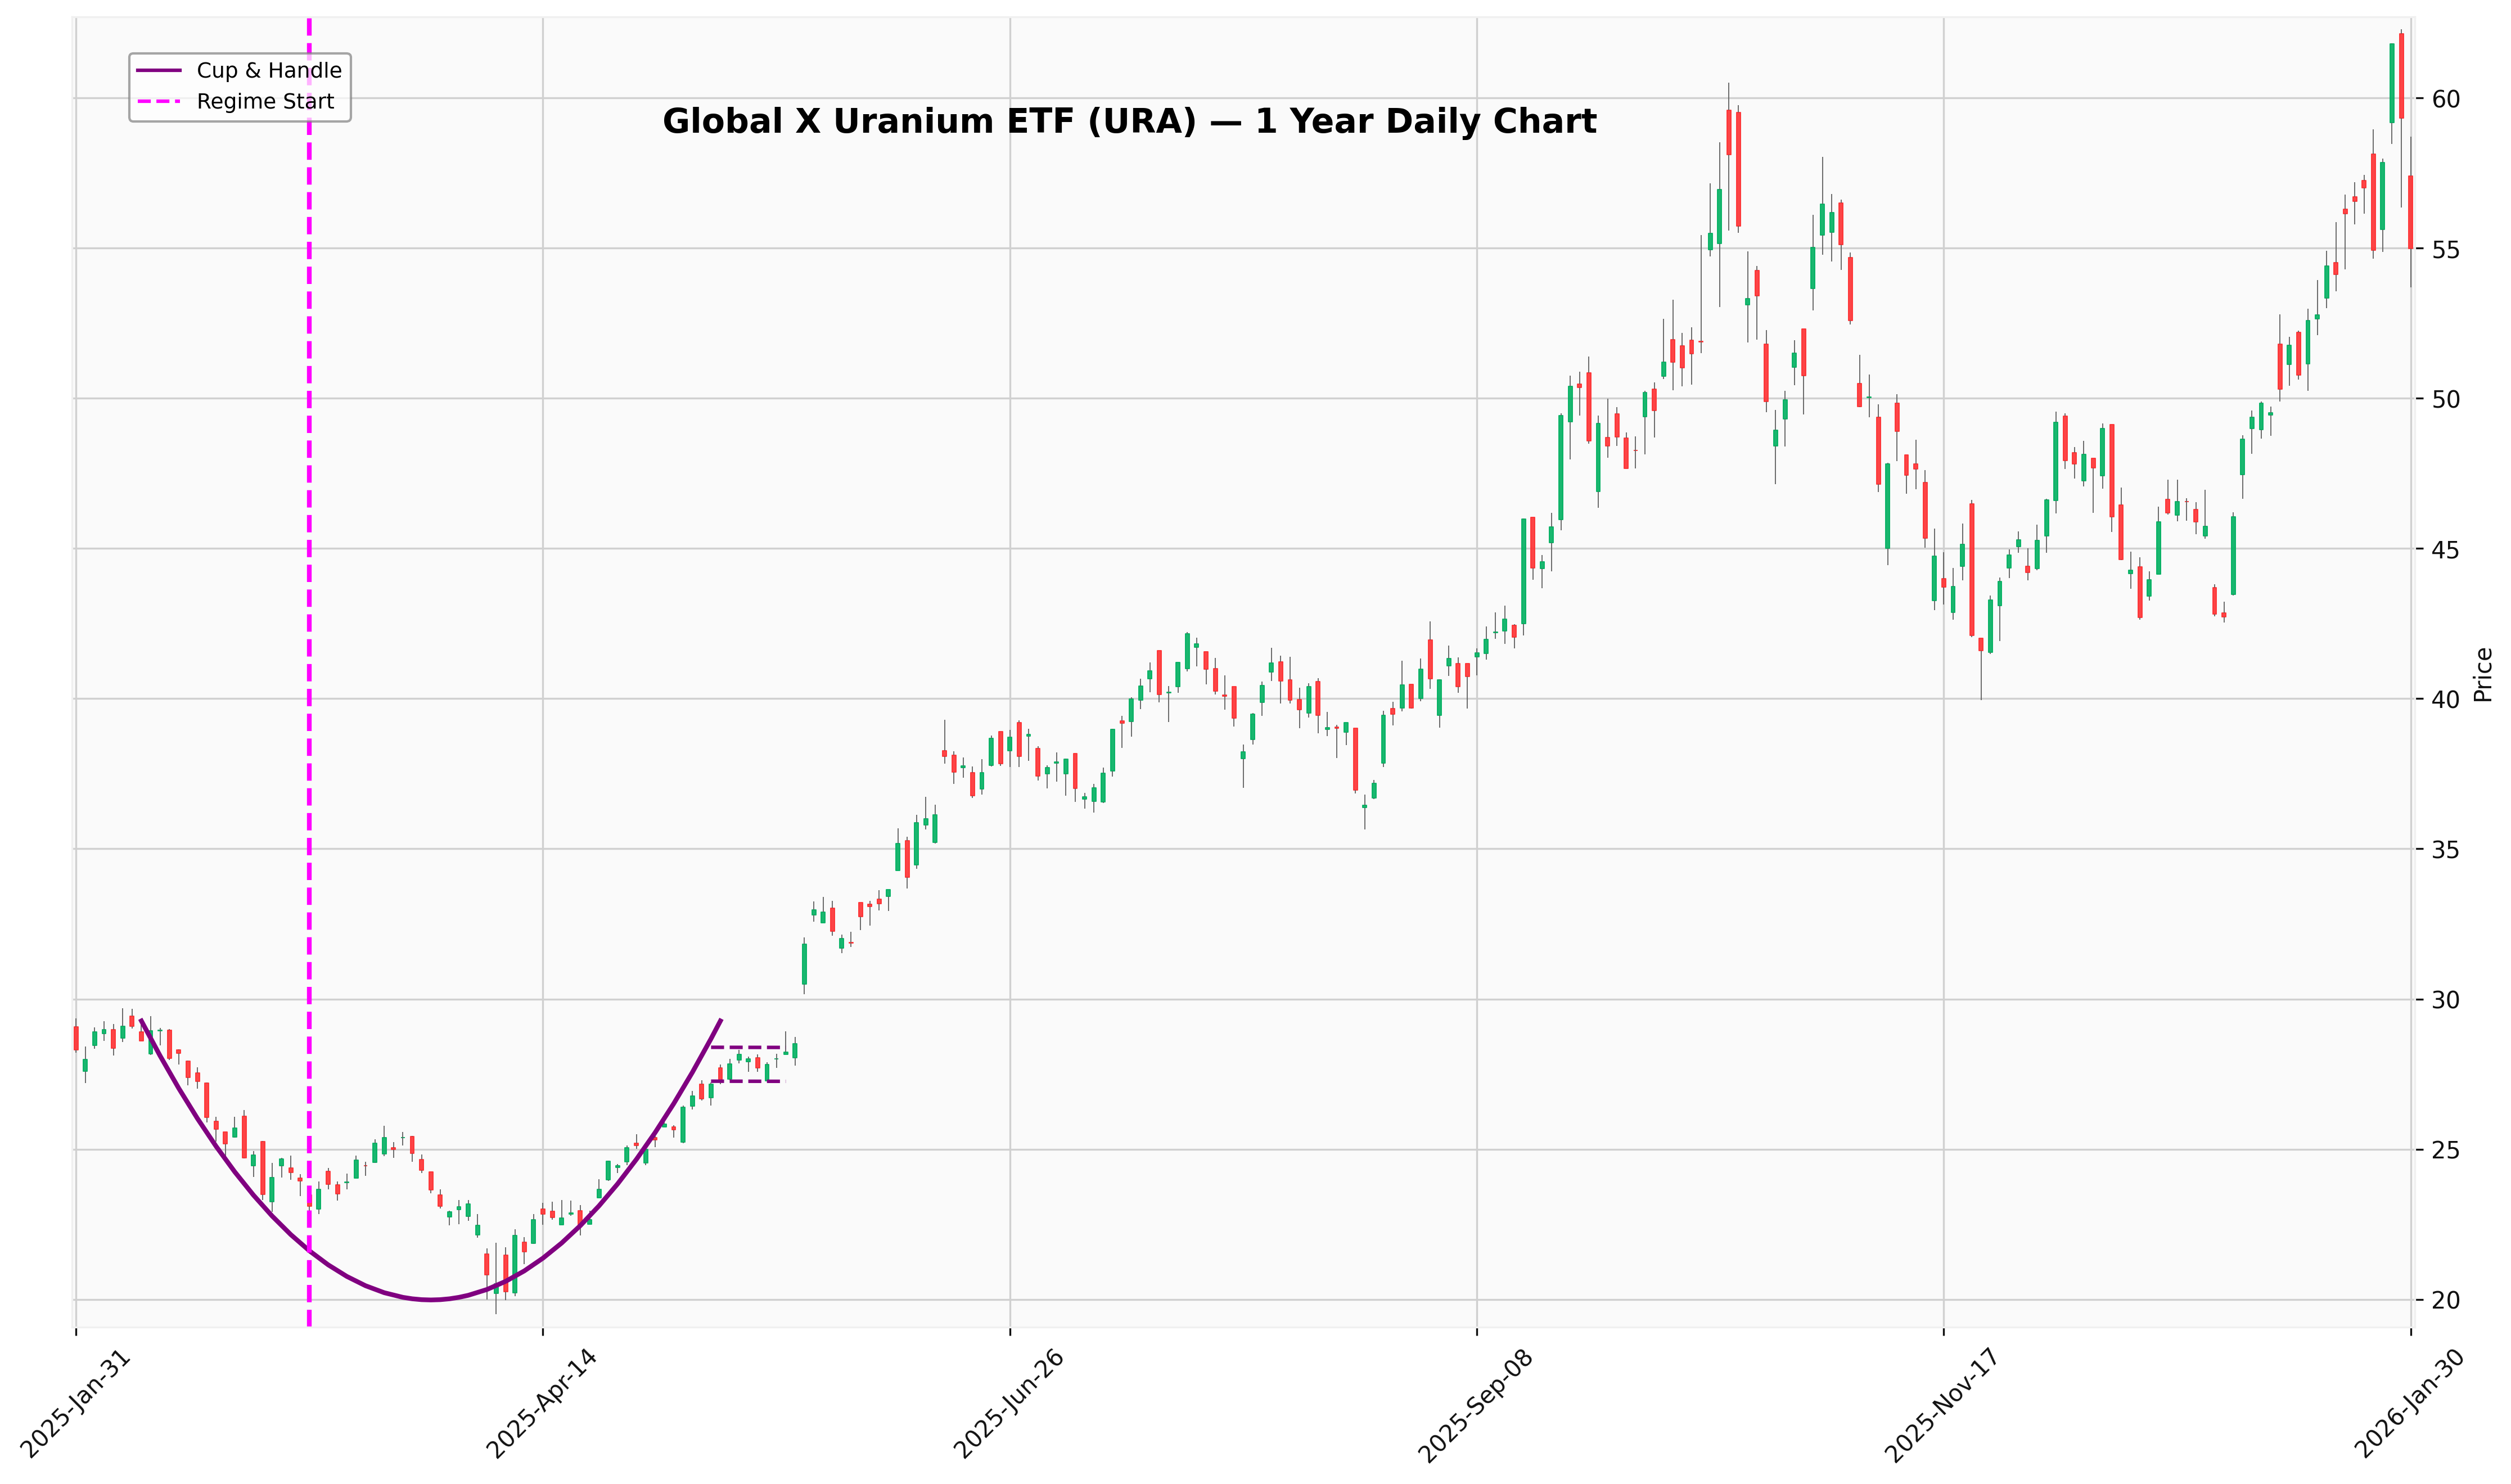
Uranium
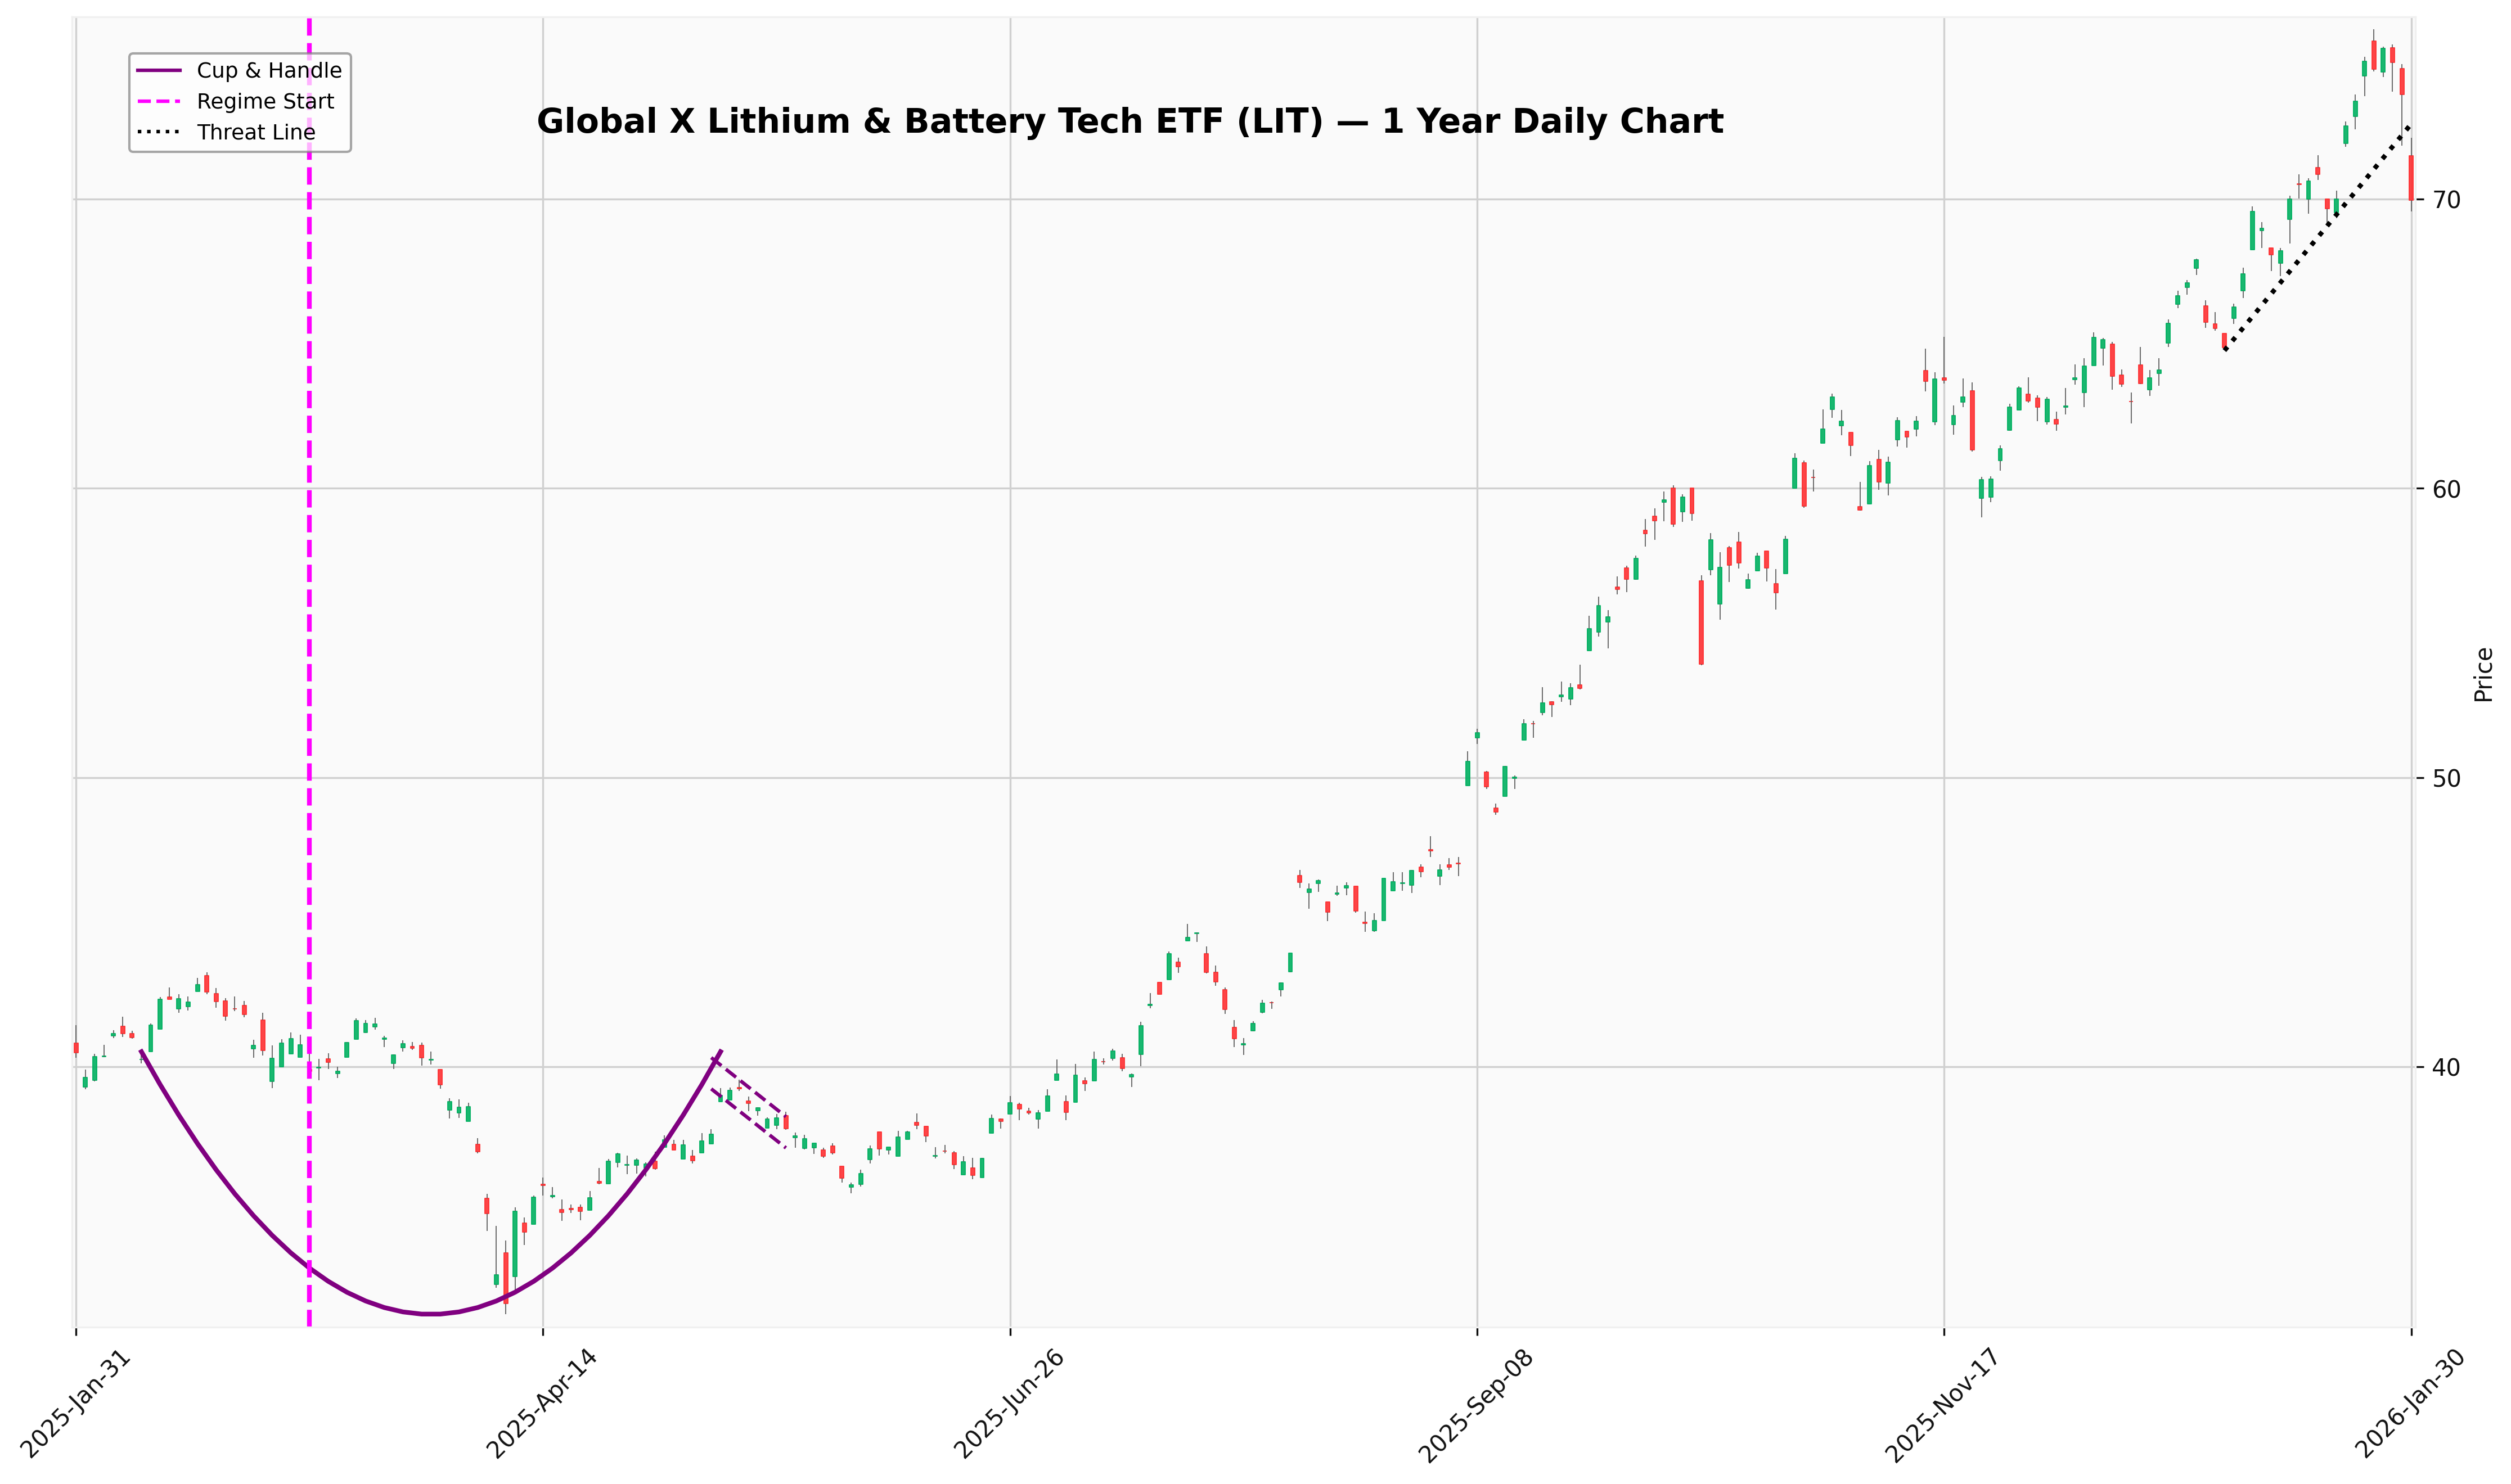
Lithium & Battery Tech
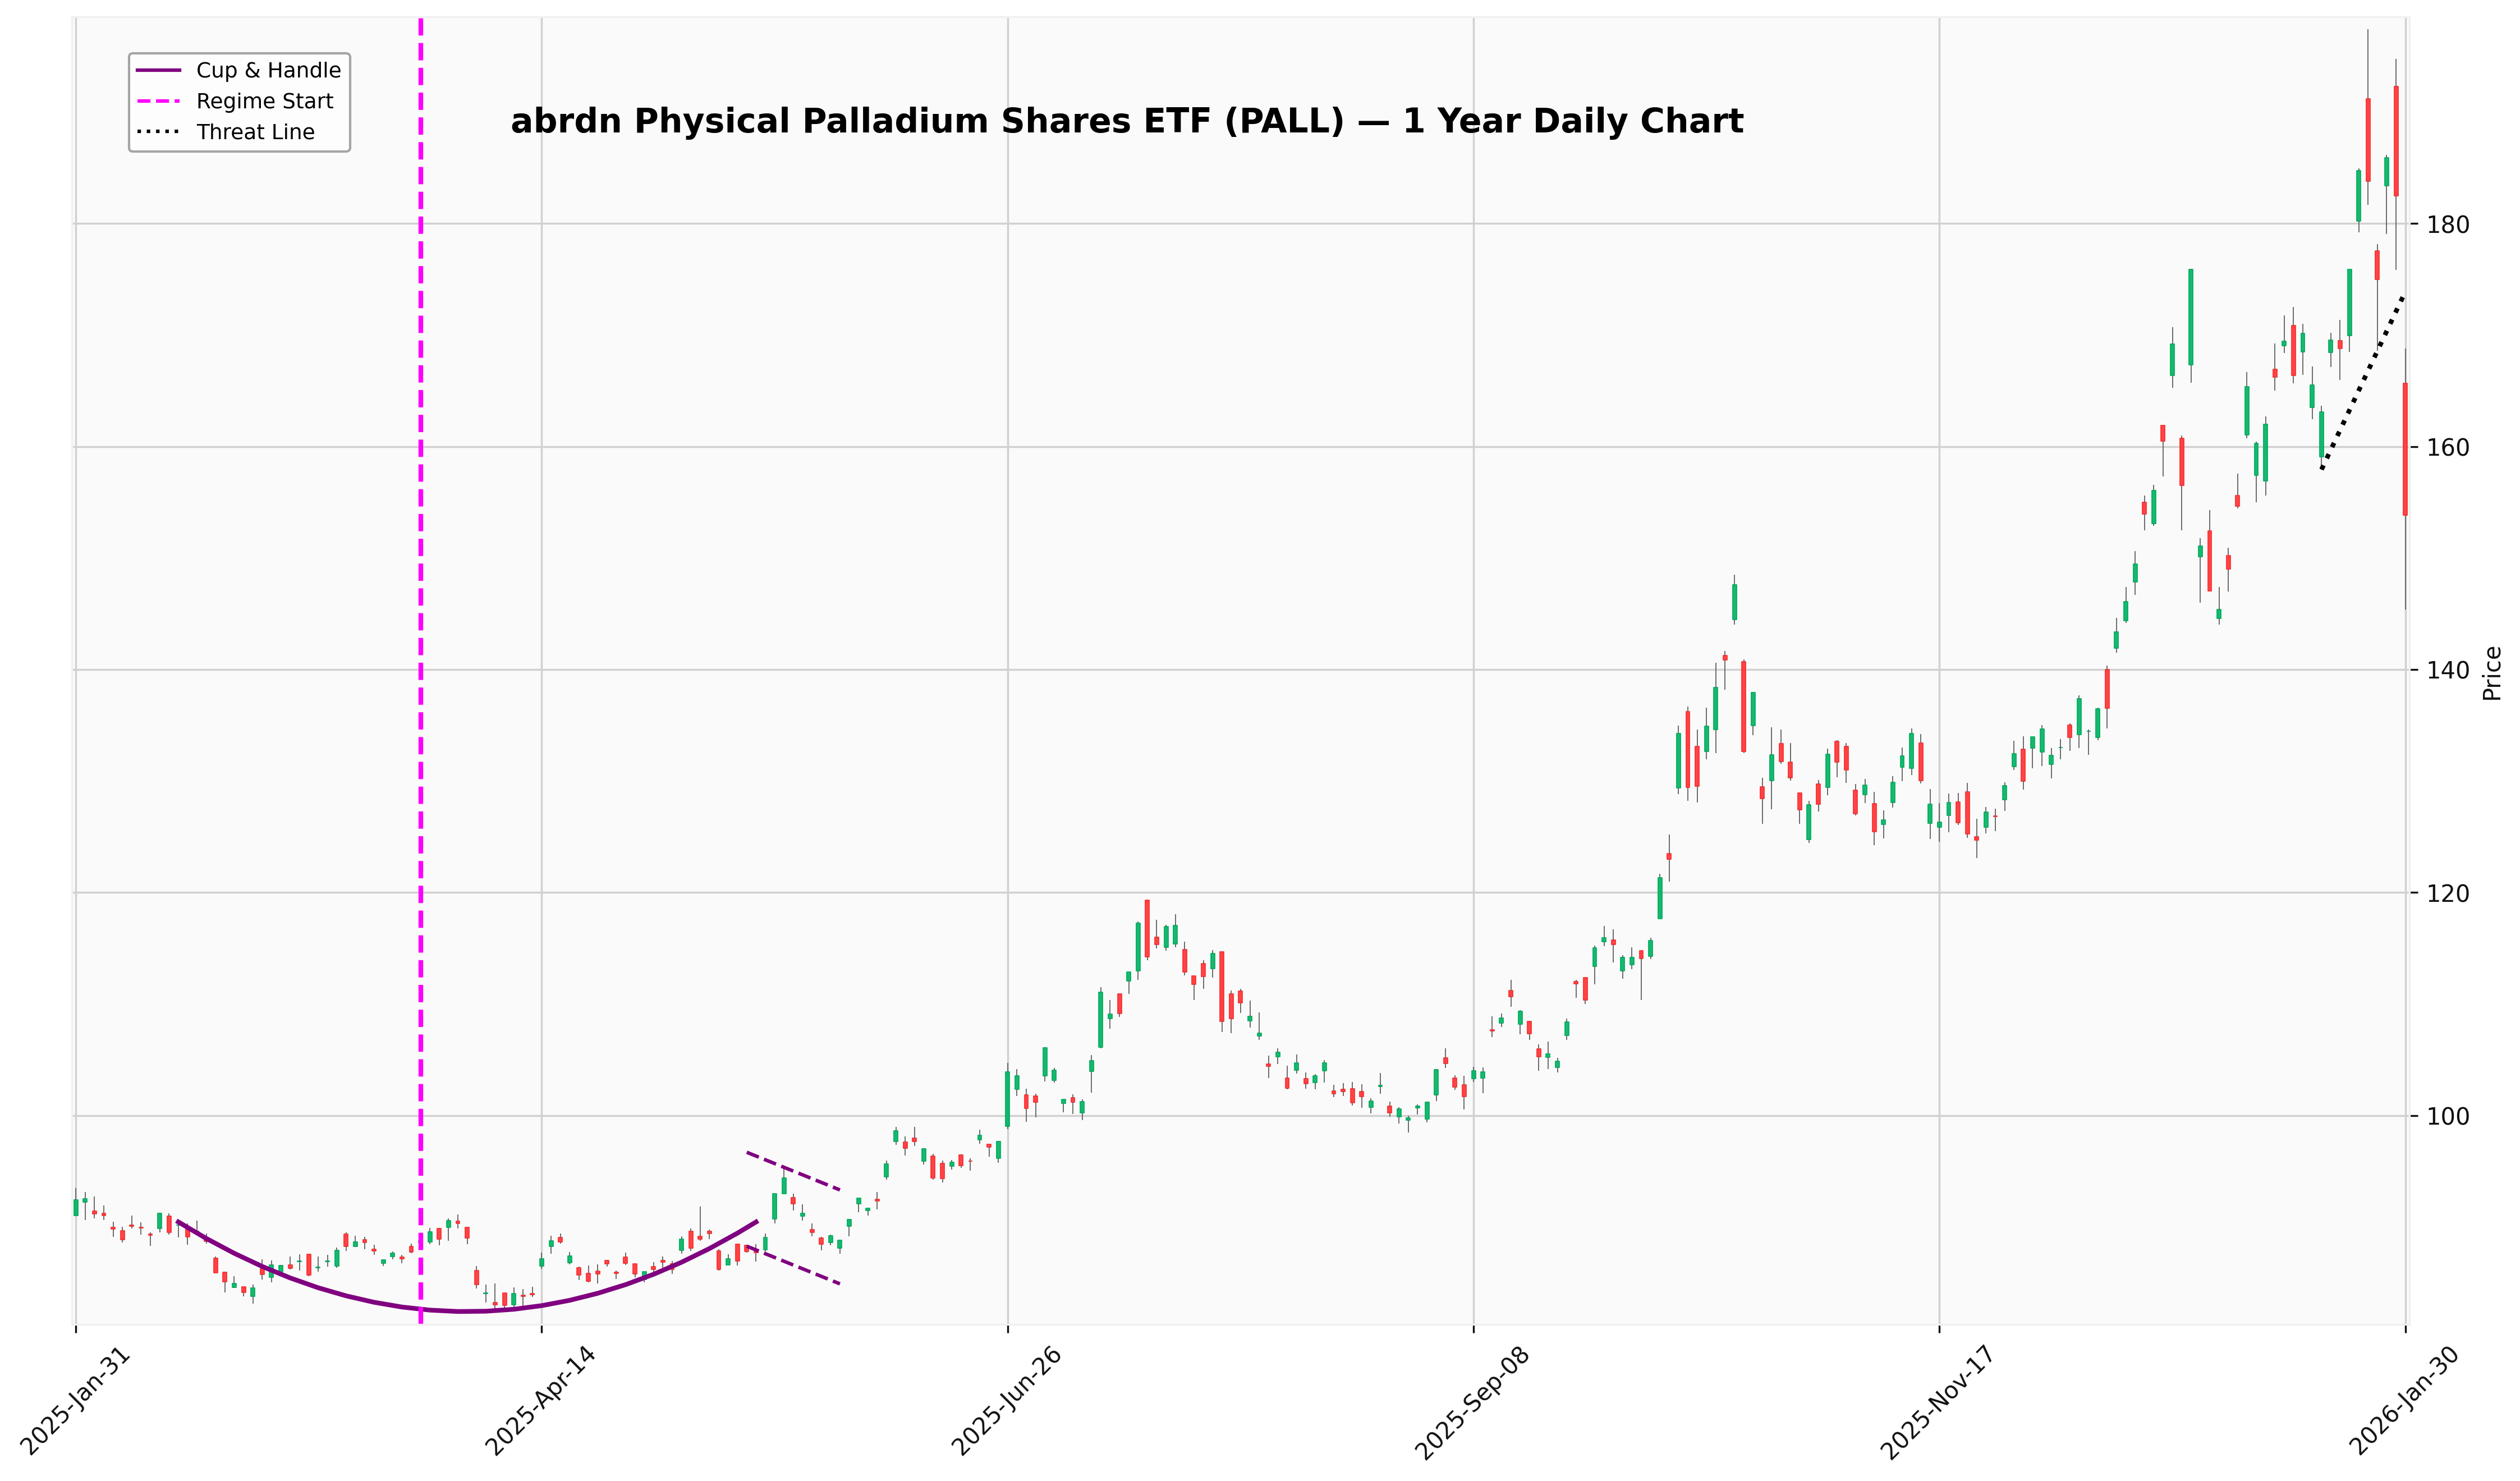
Palladium
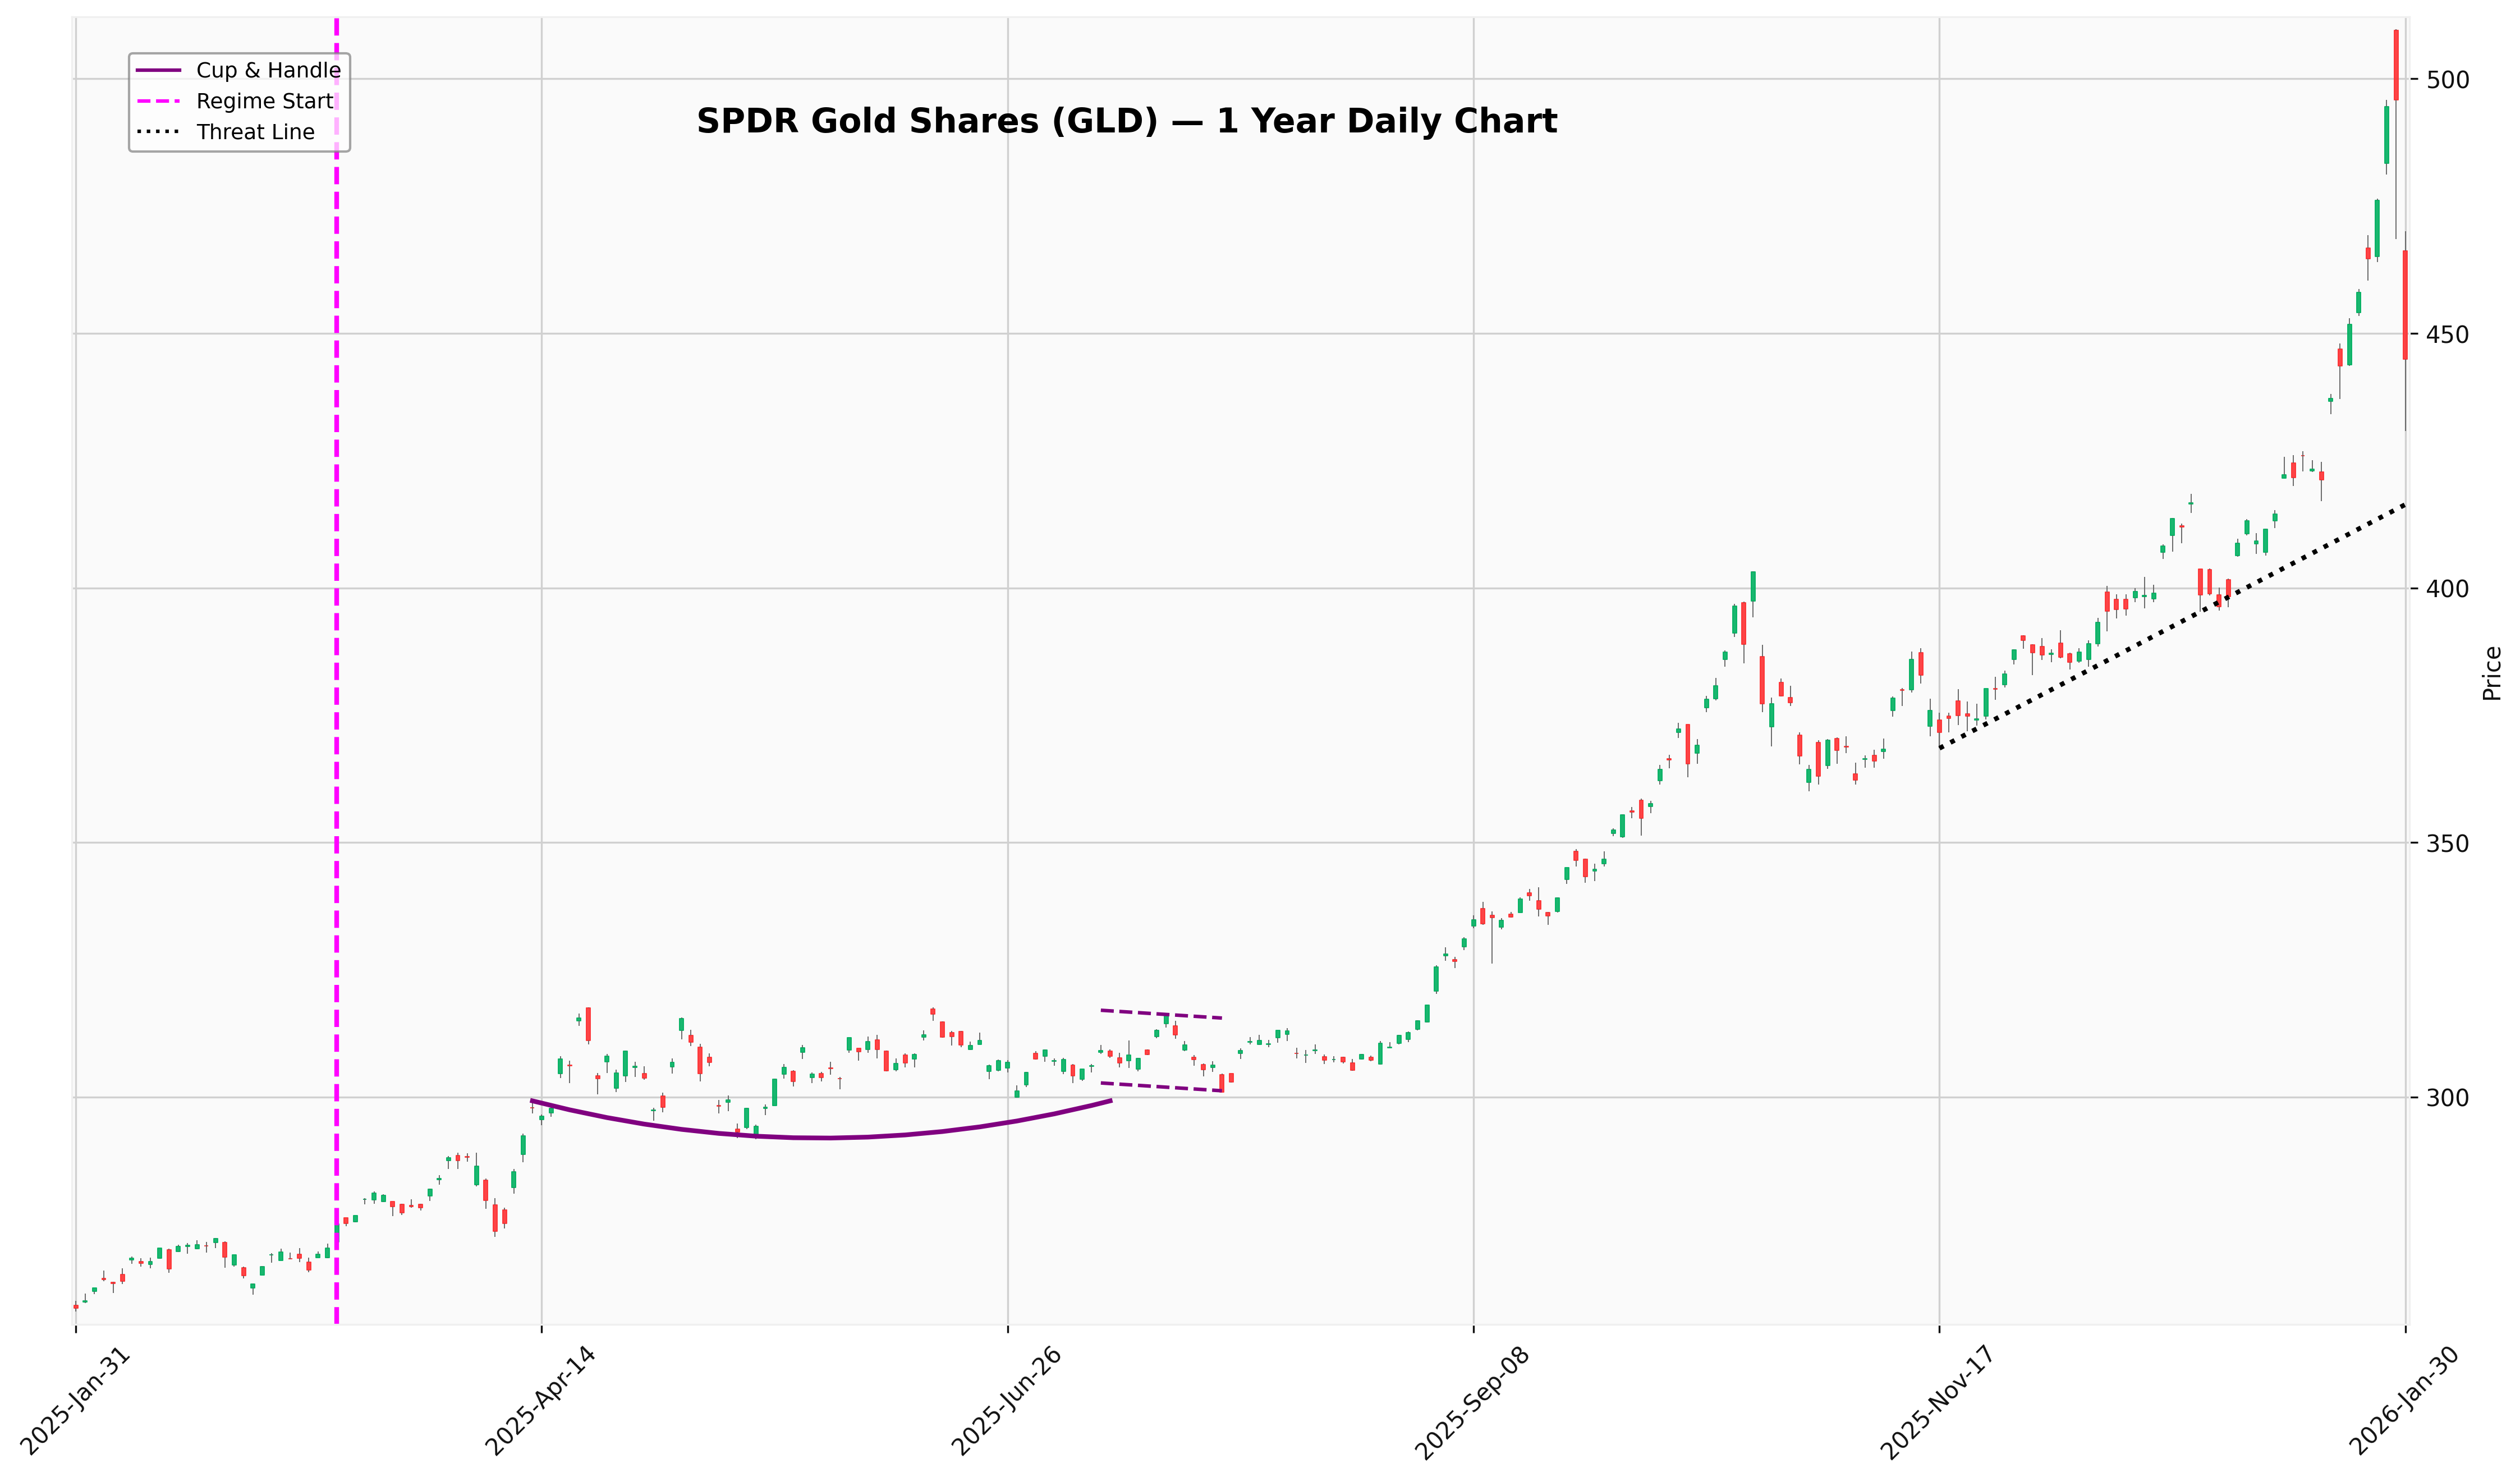
Gold
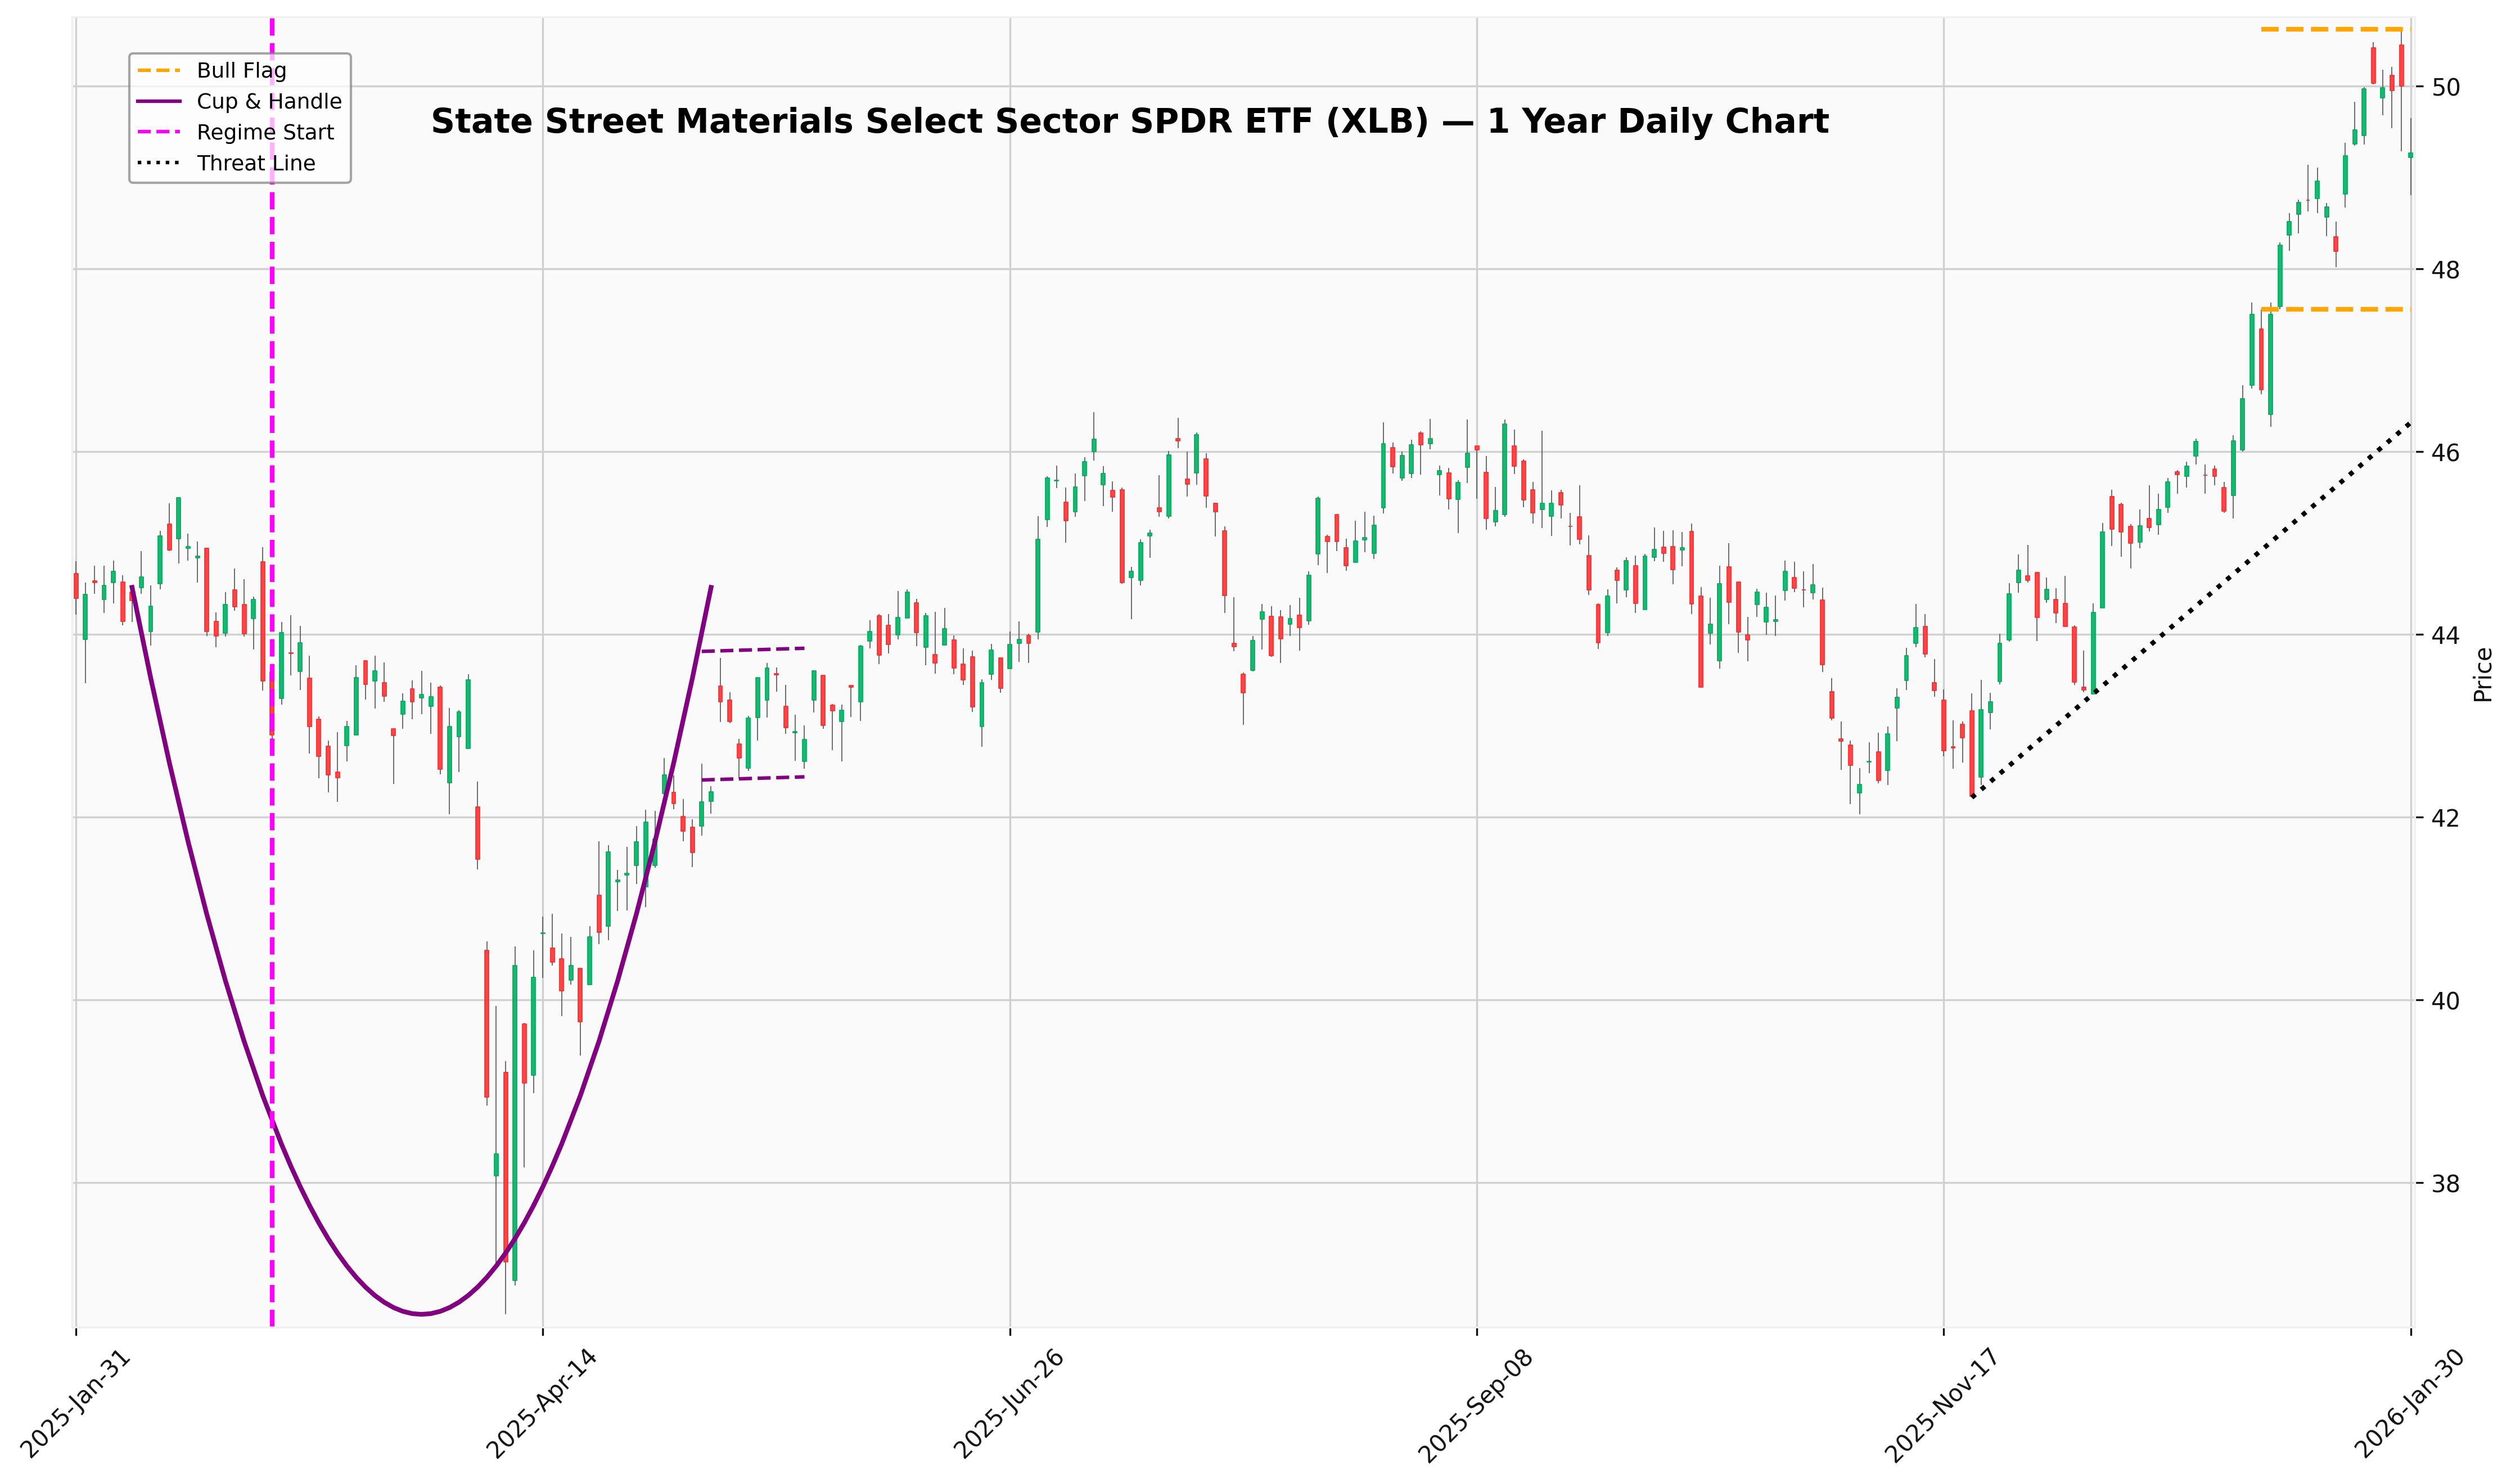
Materials Select Sector
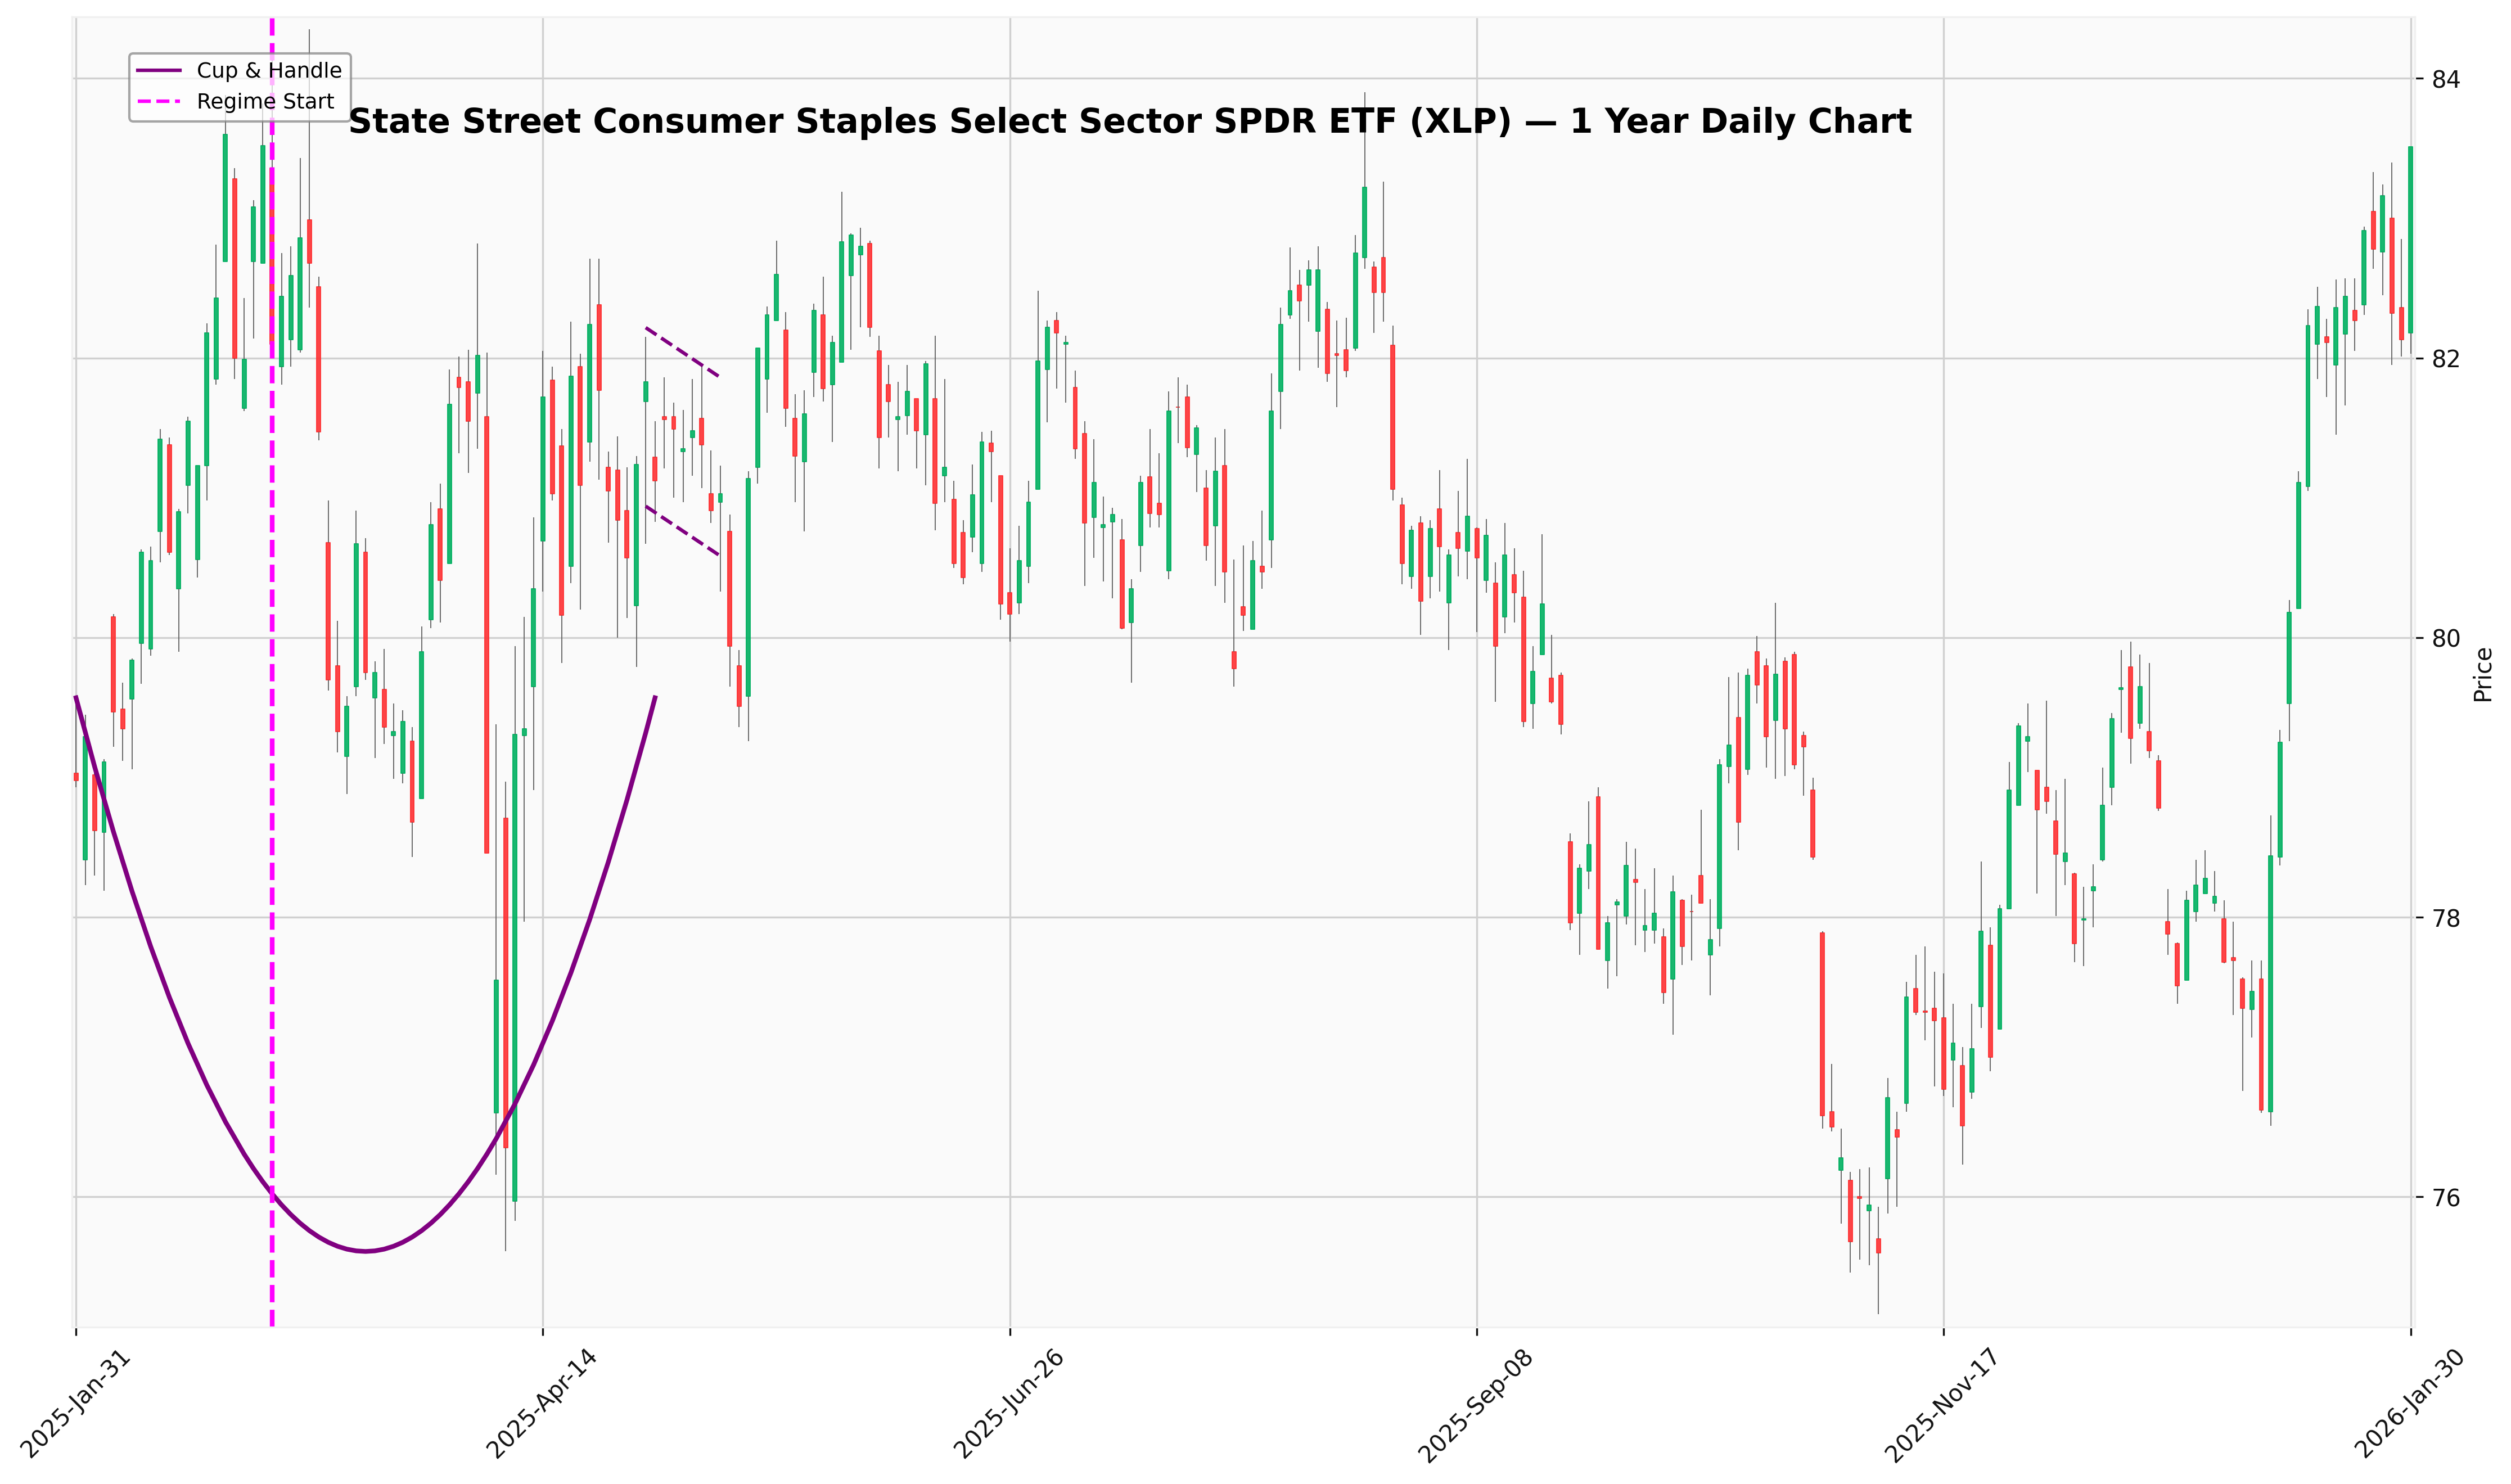
Staples SPDR
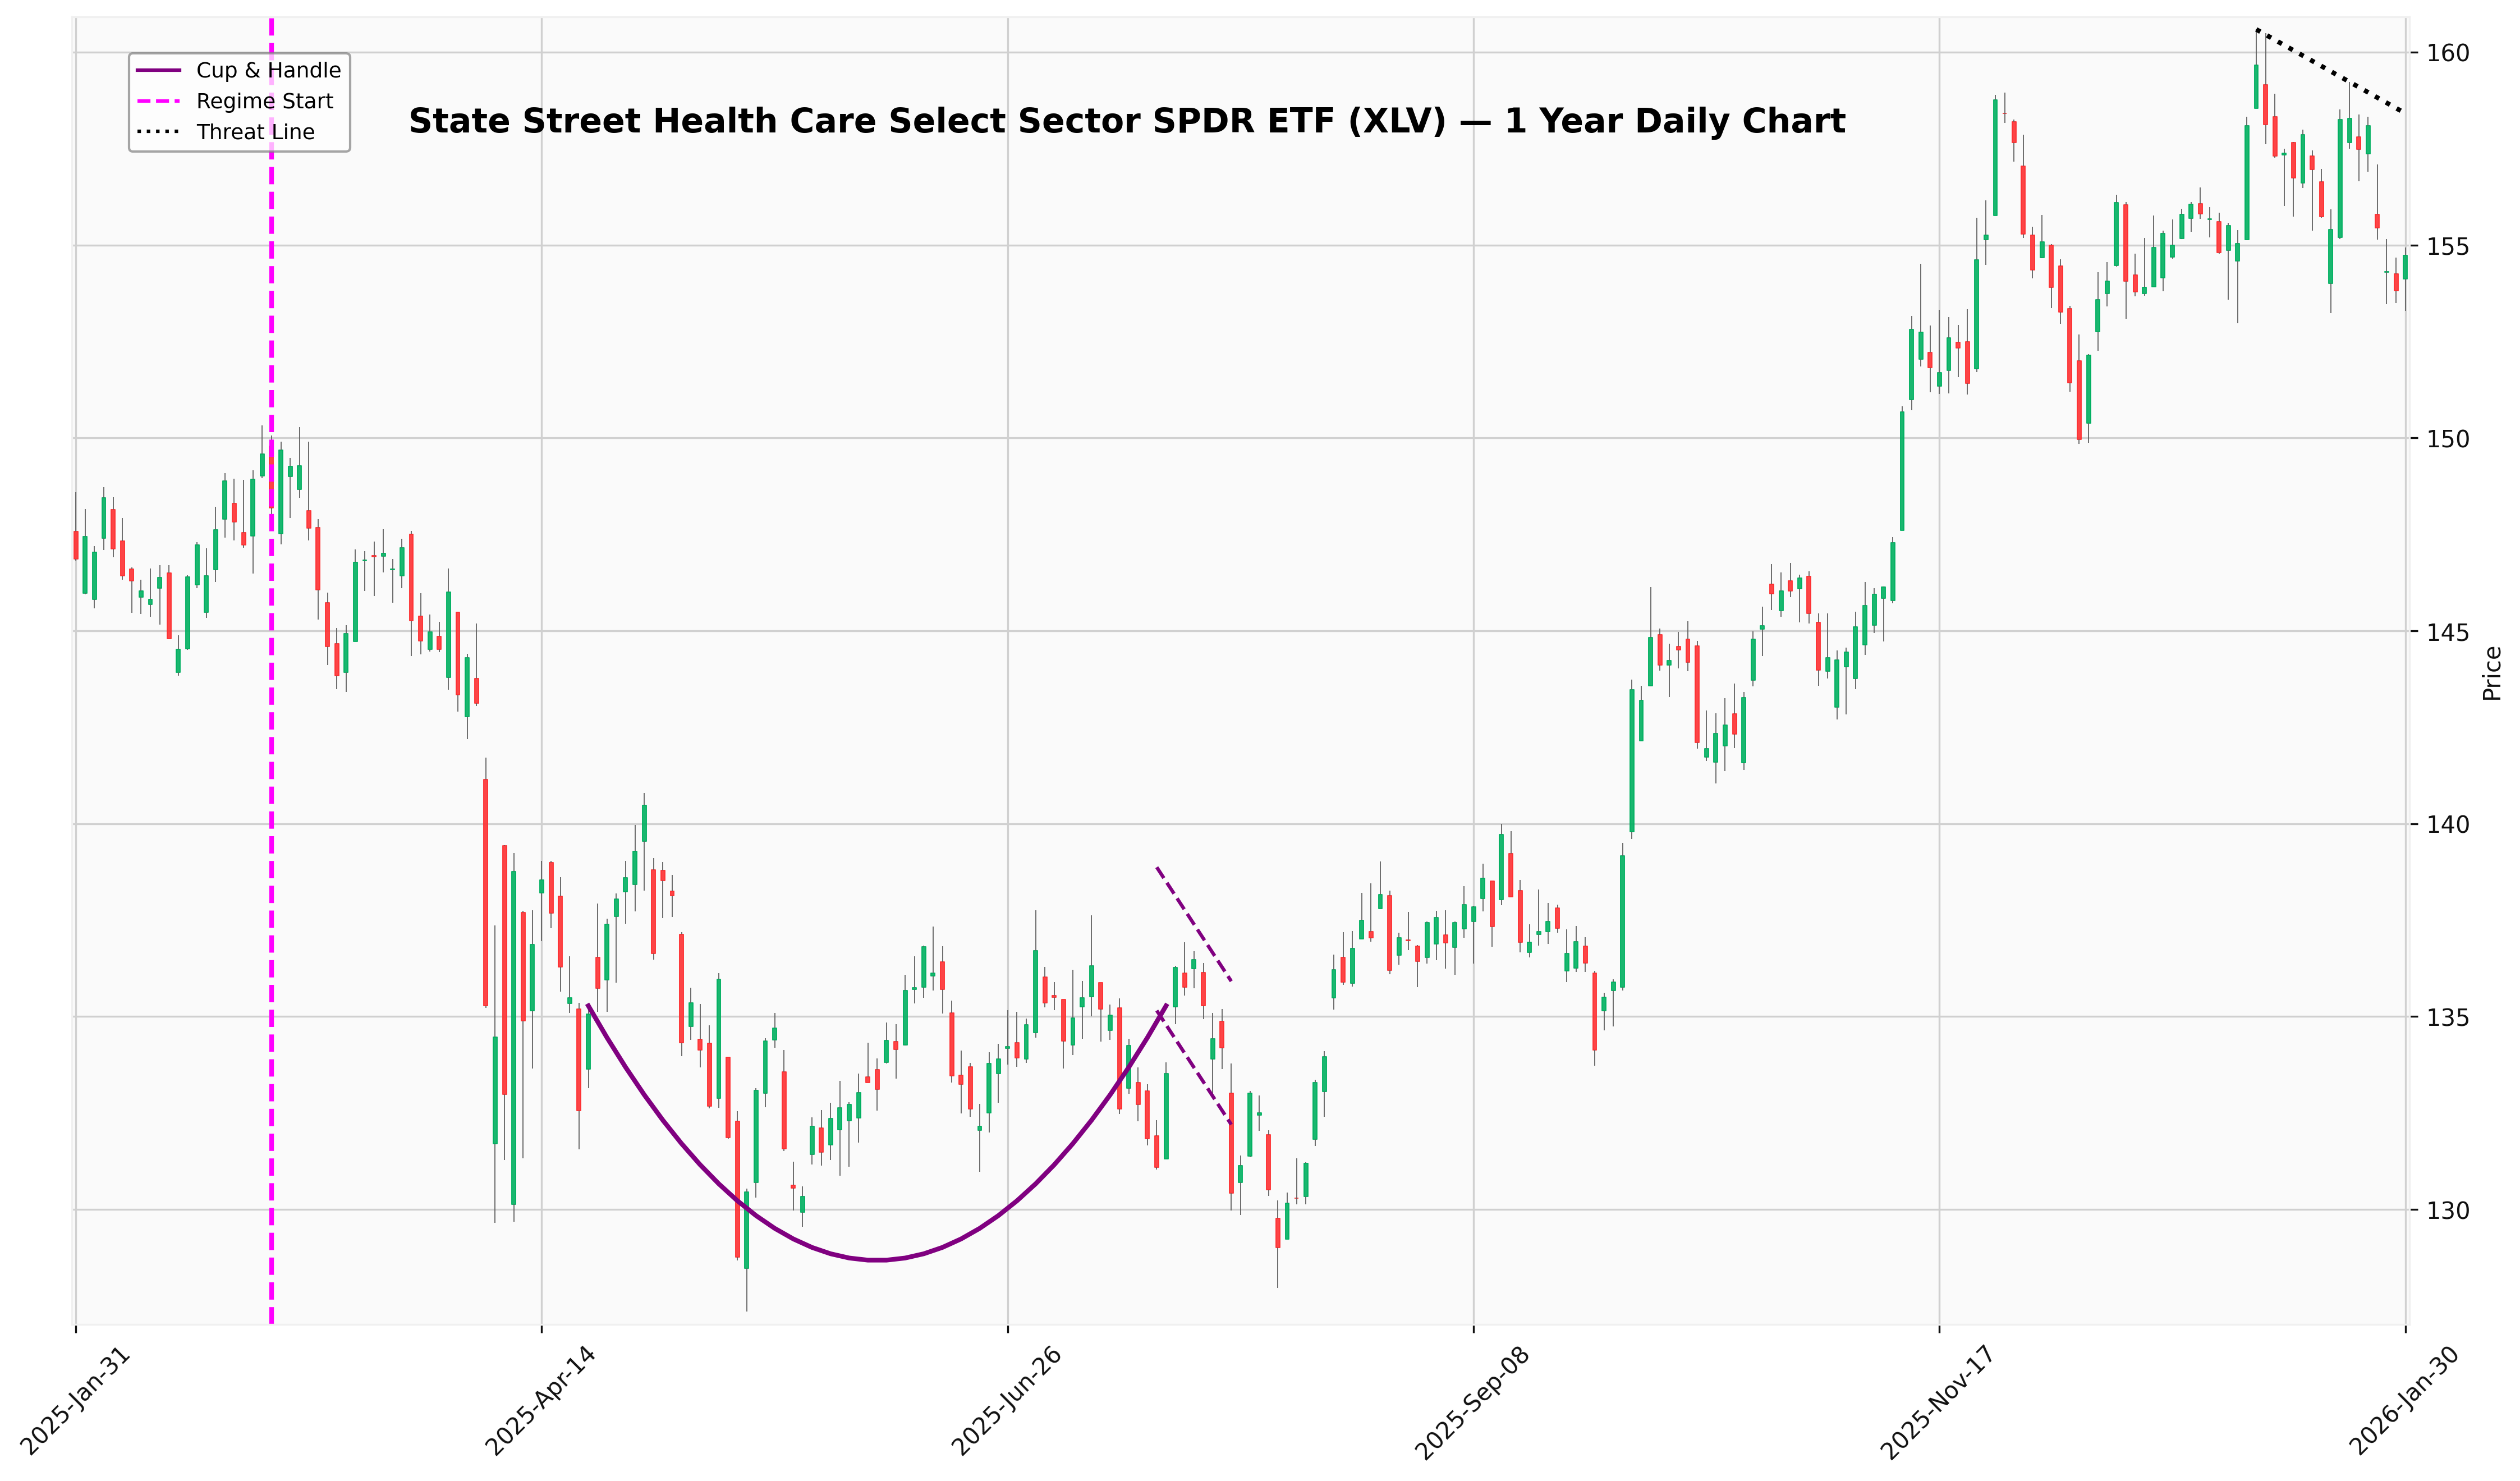
Health Care Select Sector SPDR
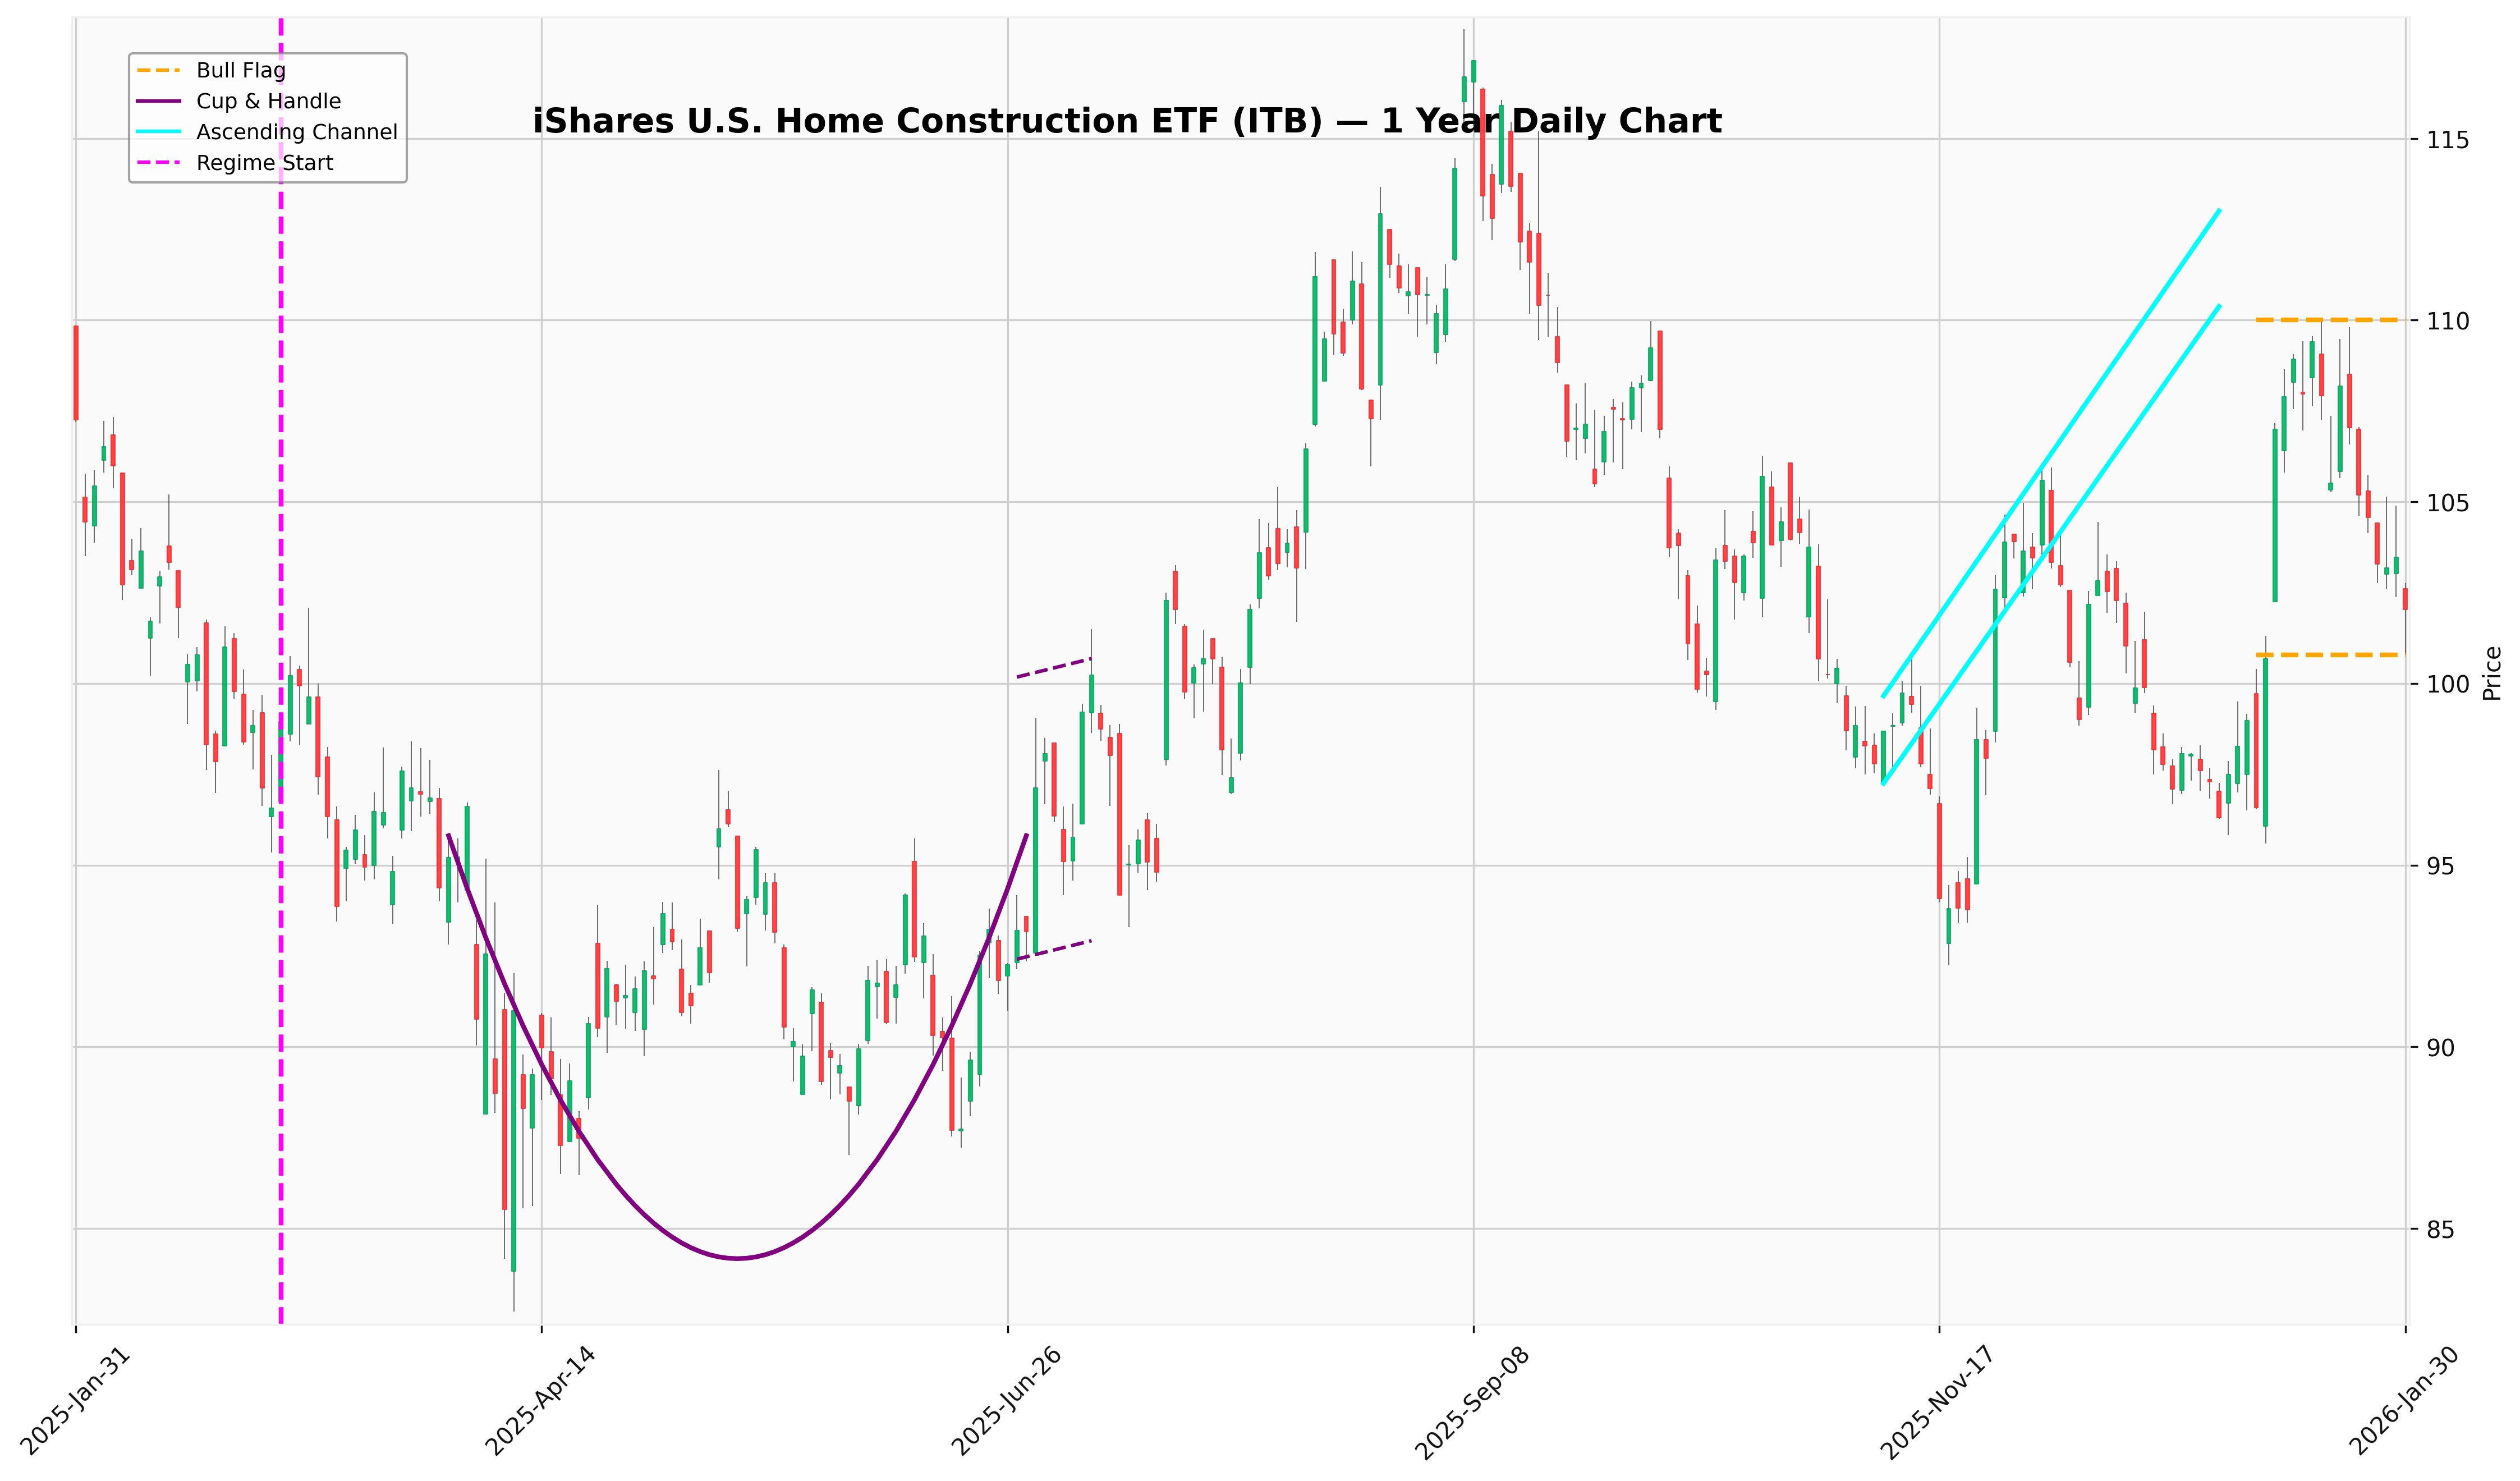
iShares US Home Construction
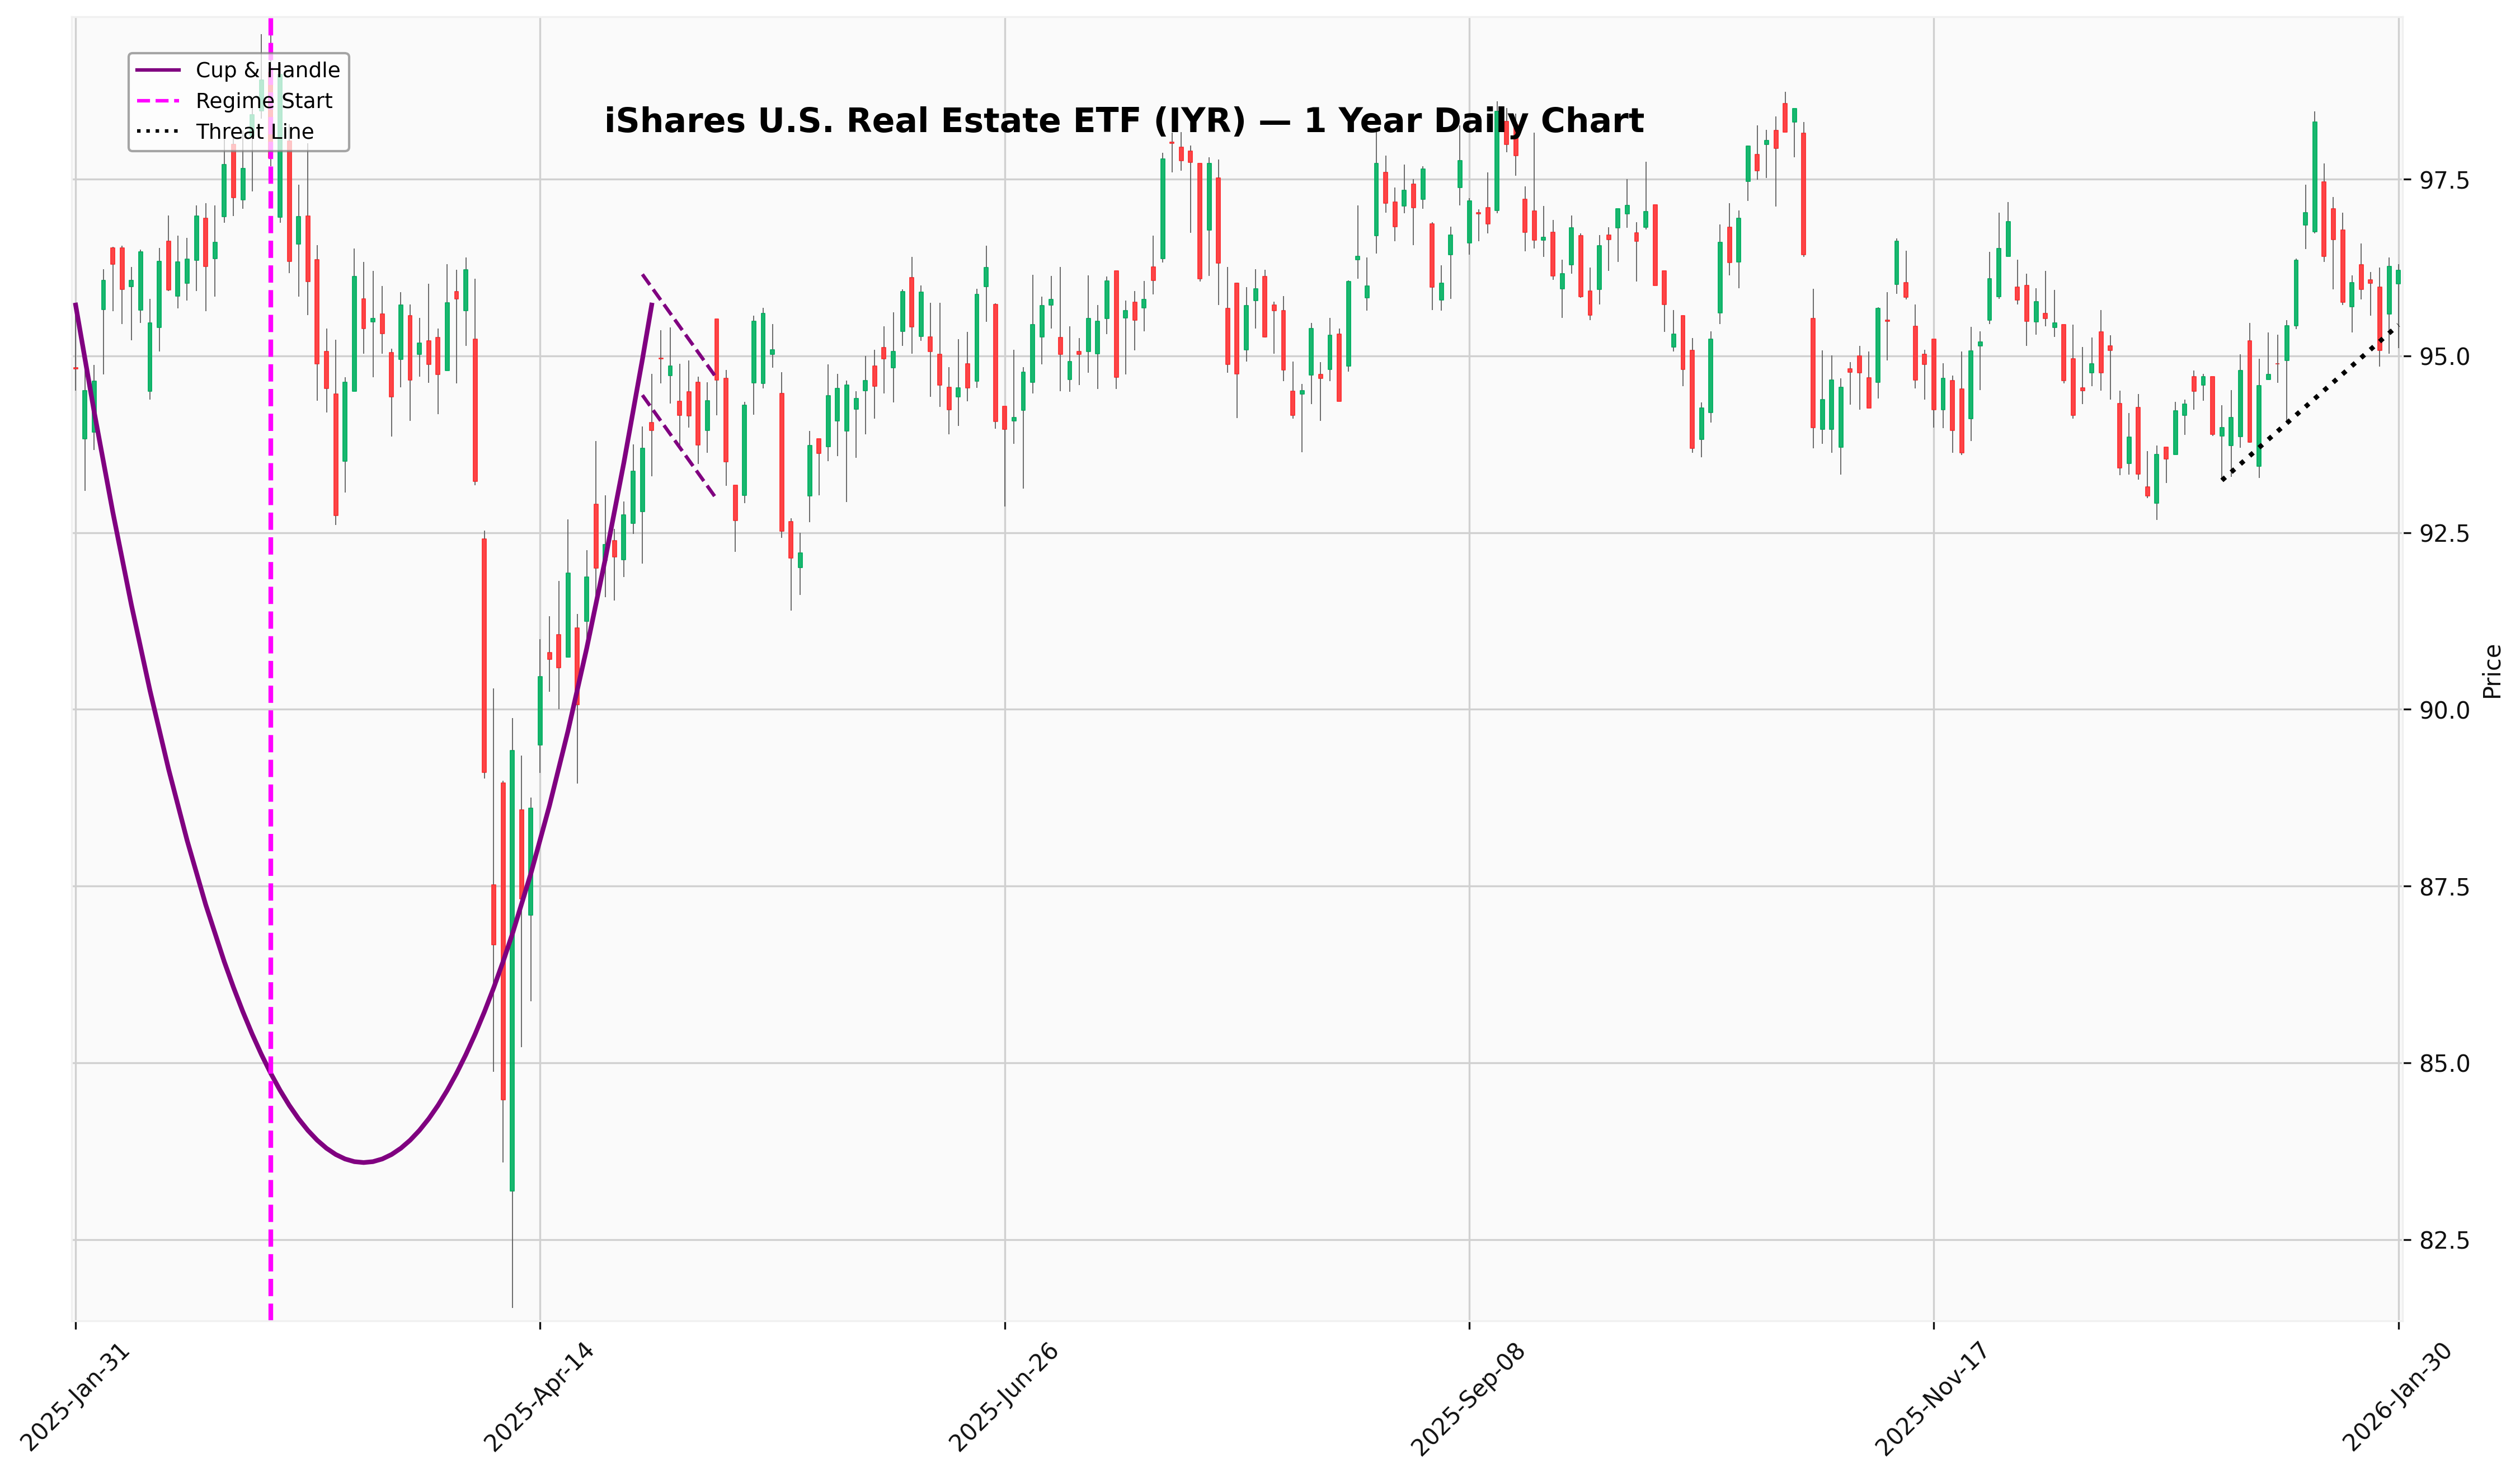
iShares US Real Estate
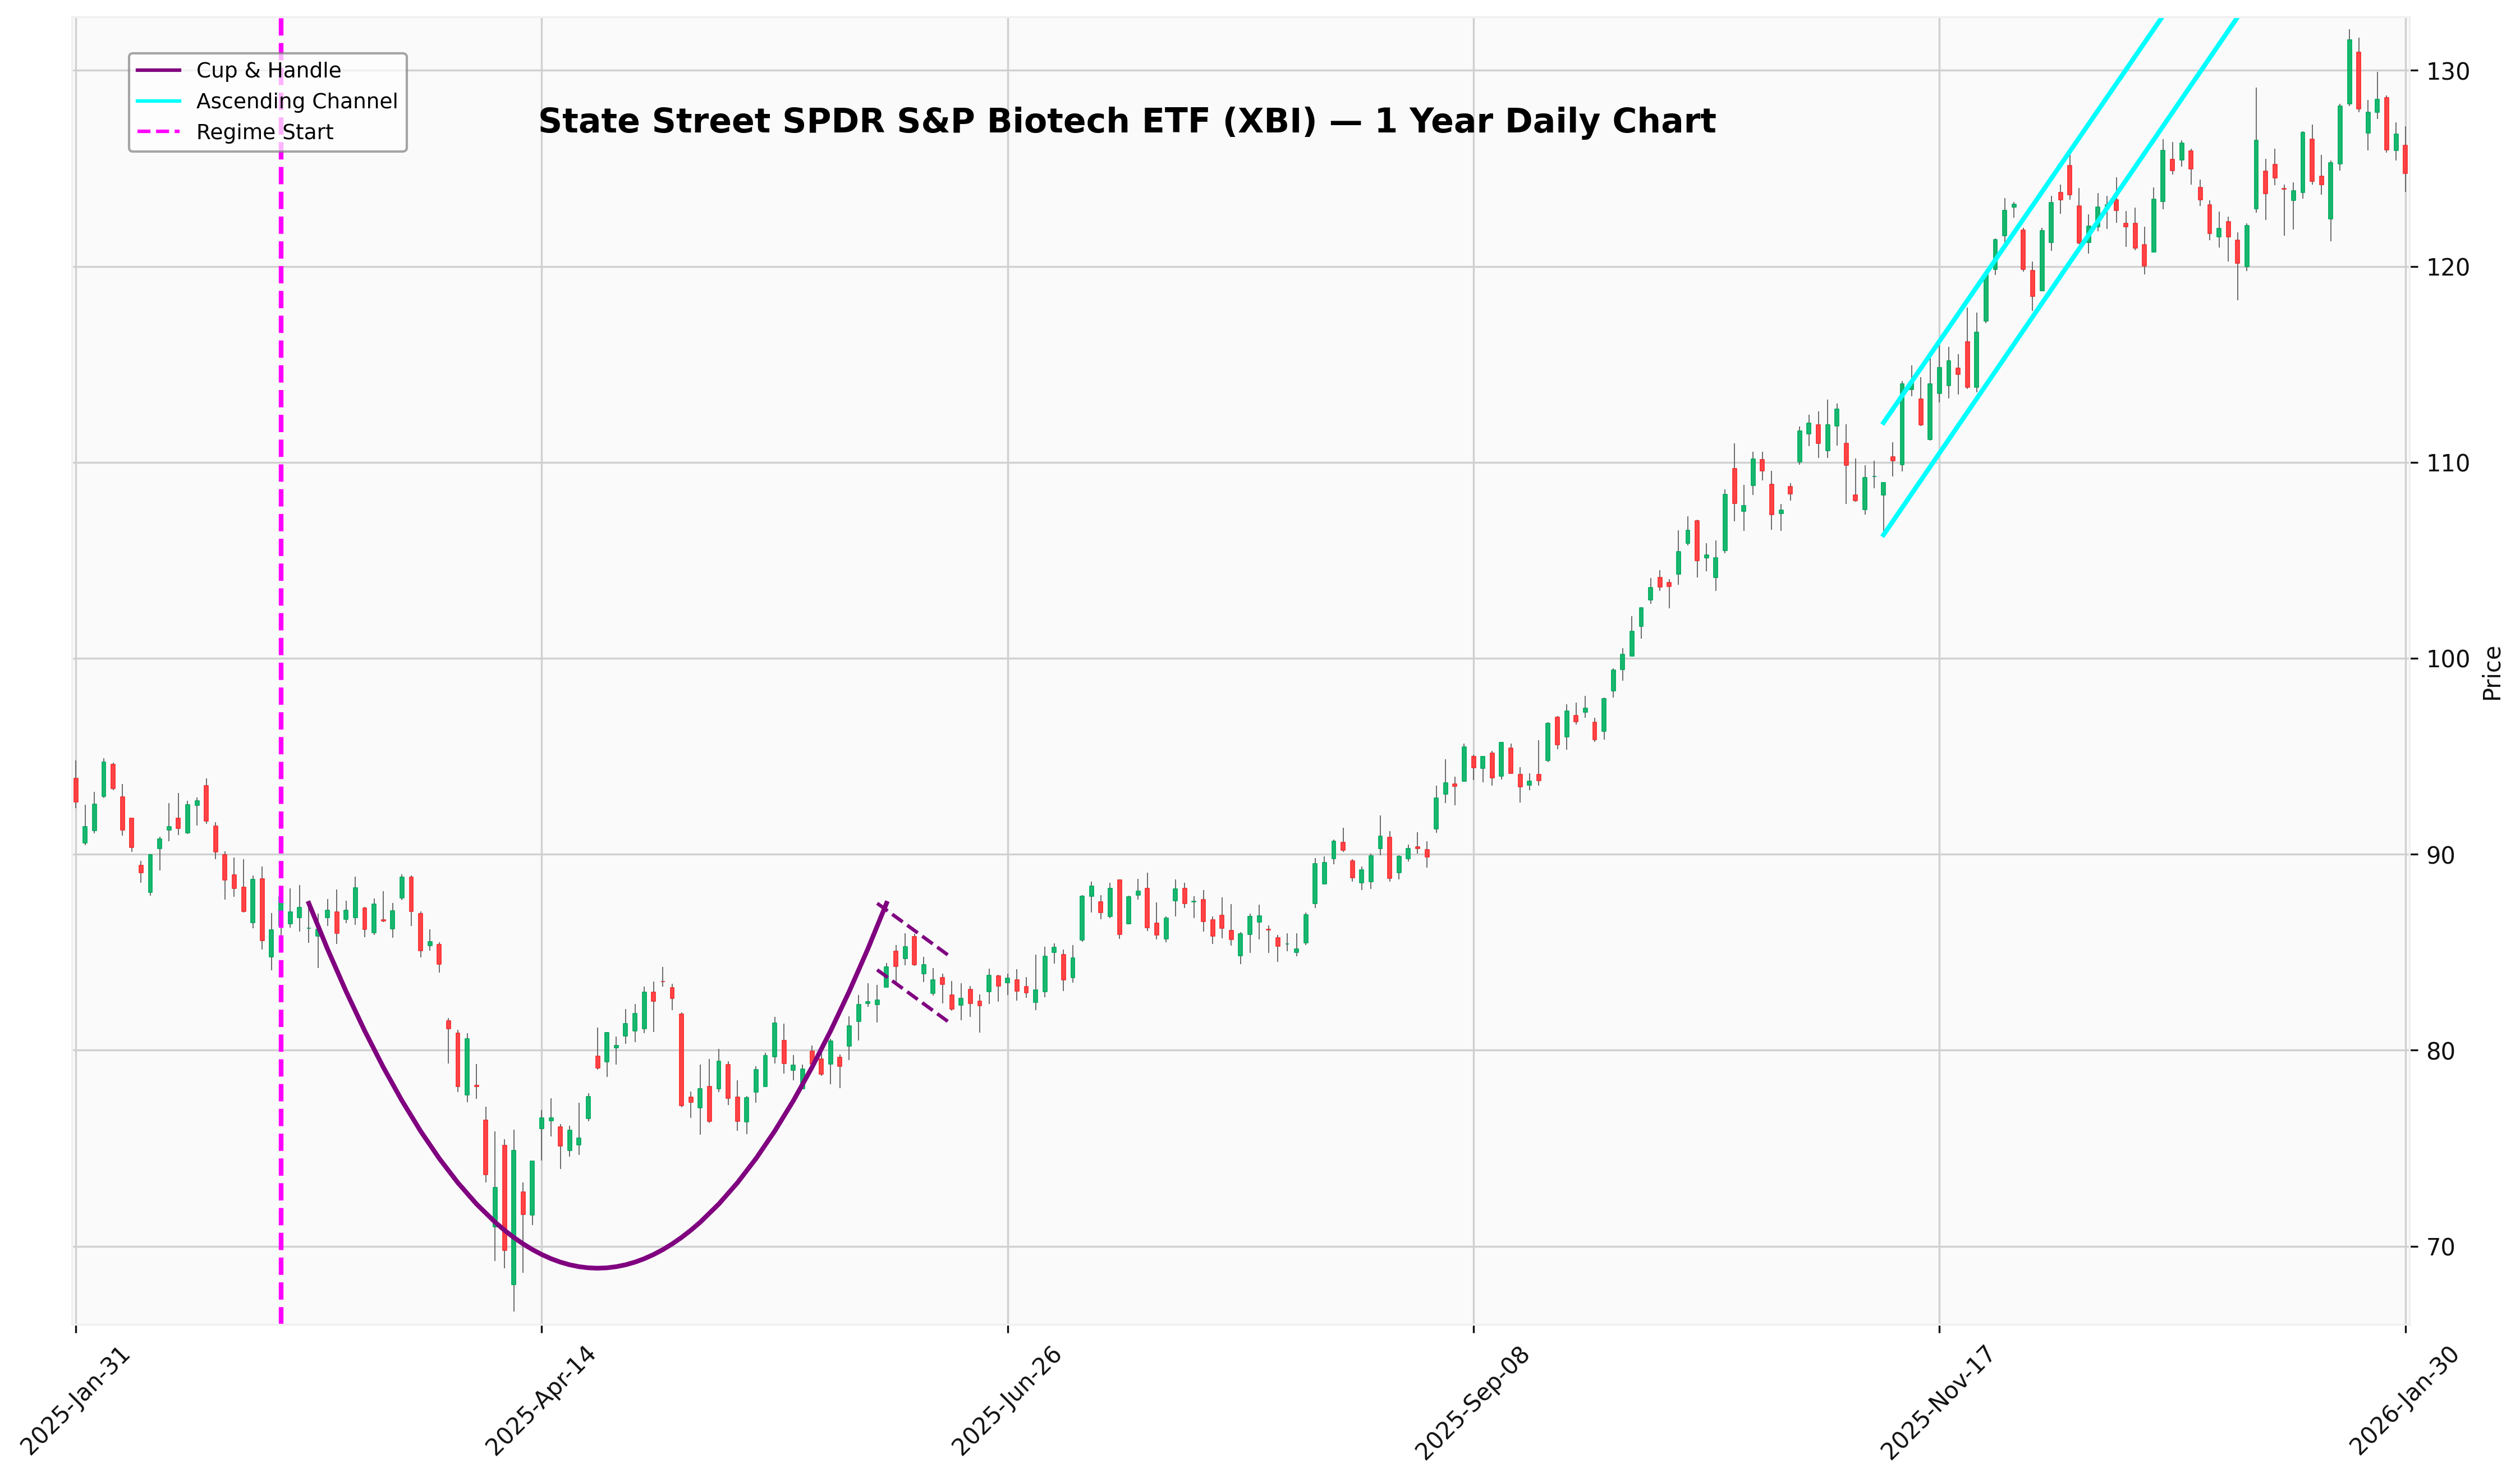
S&P Biotech
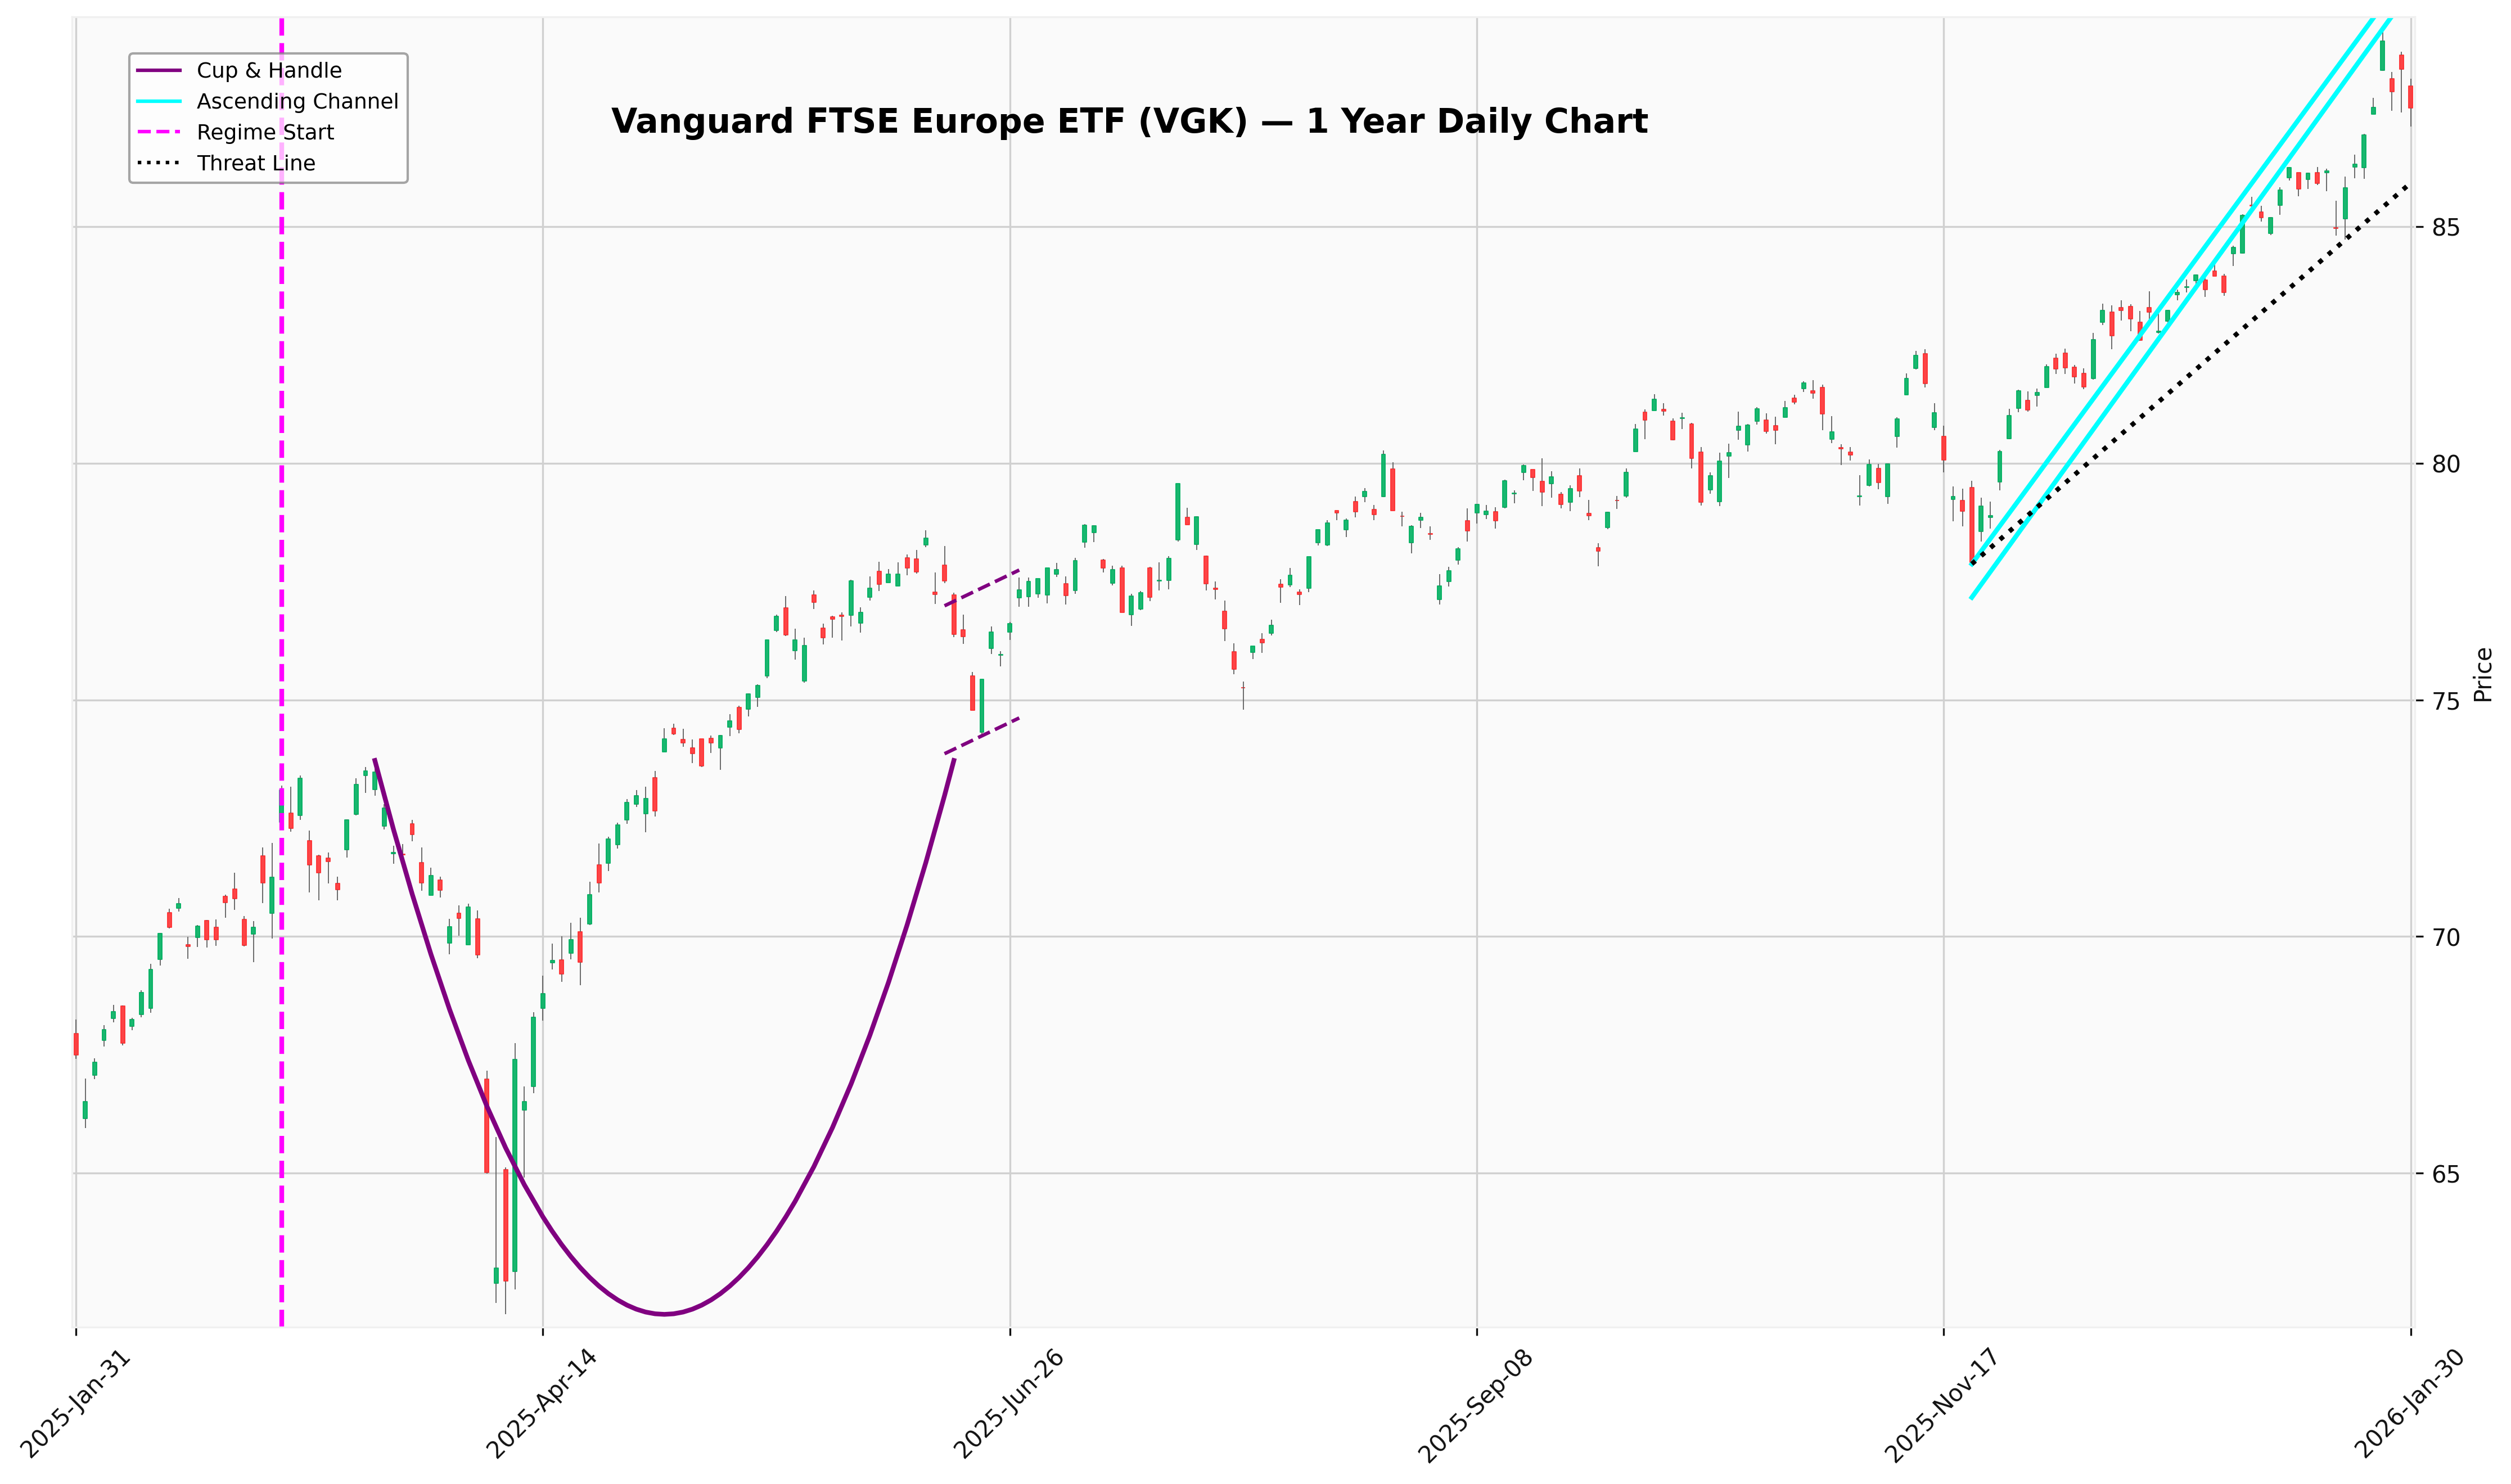
European Stock Index
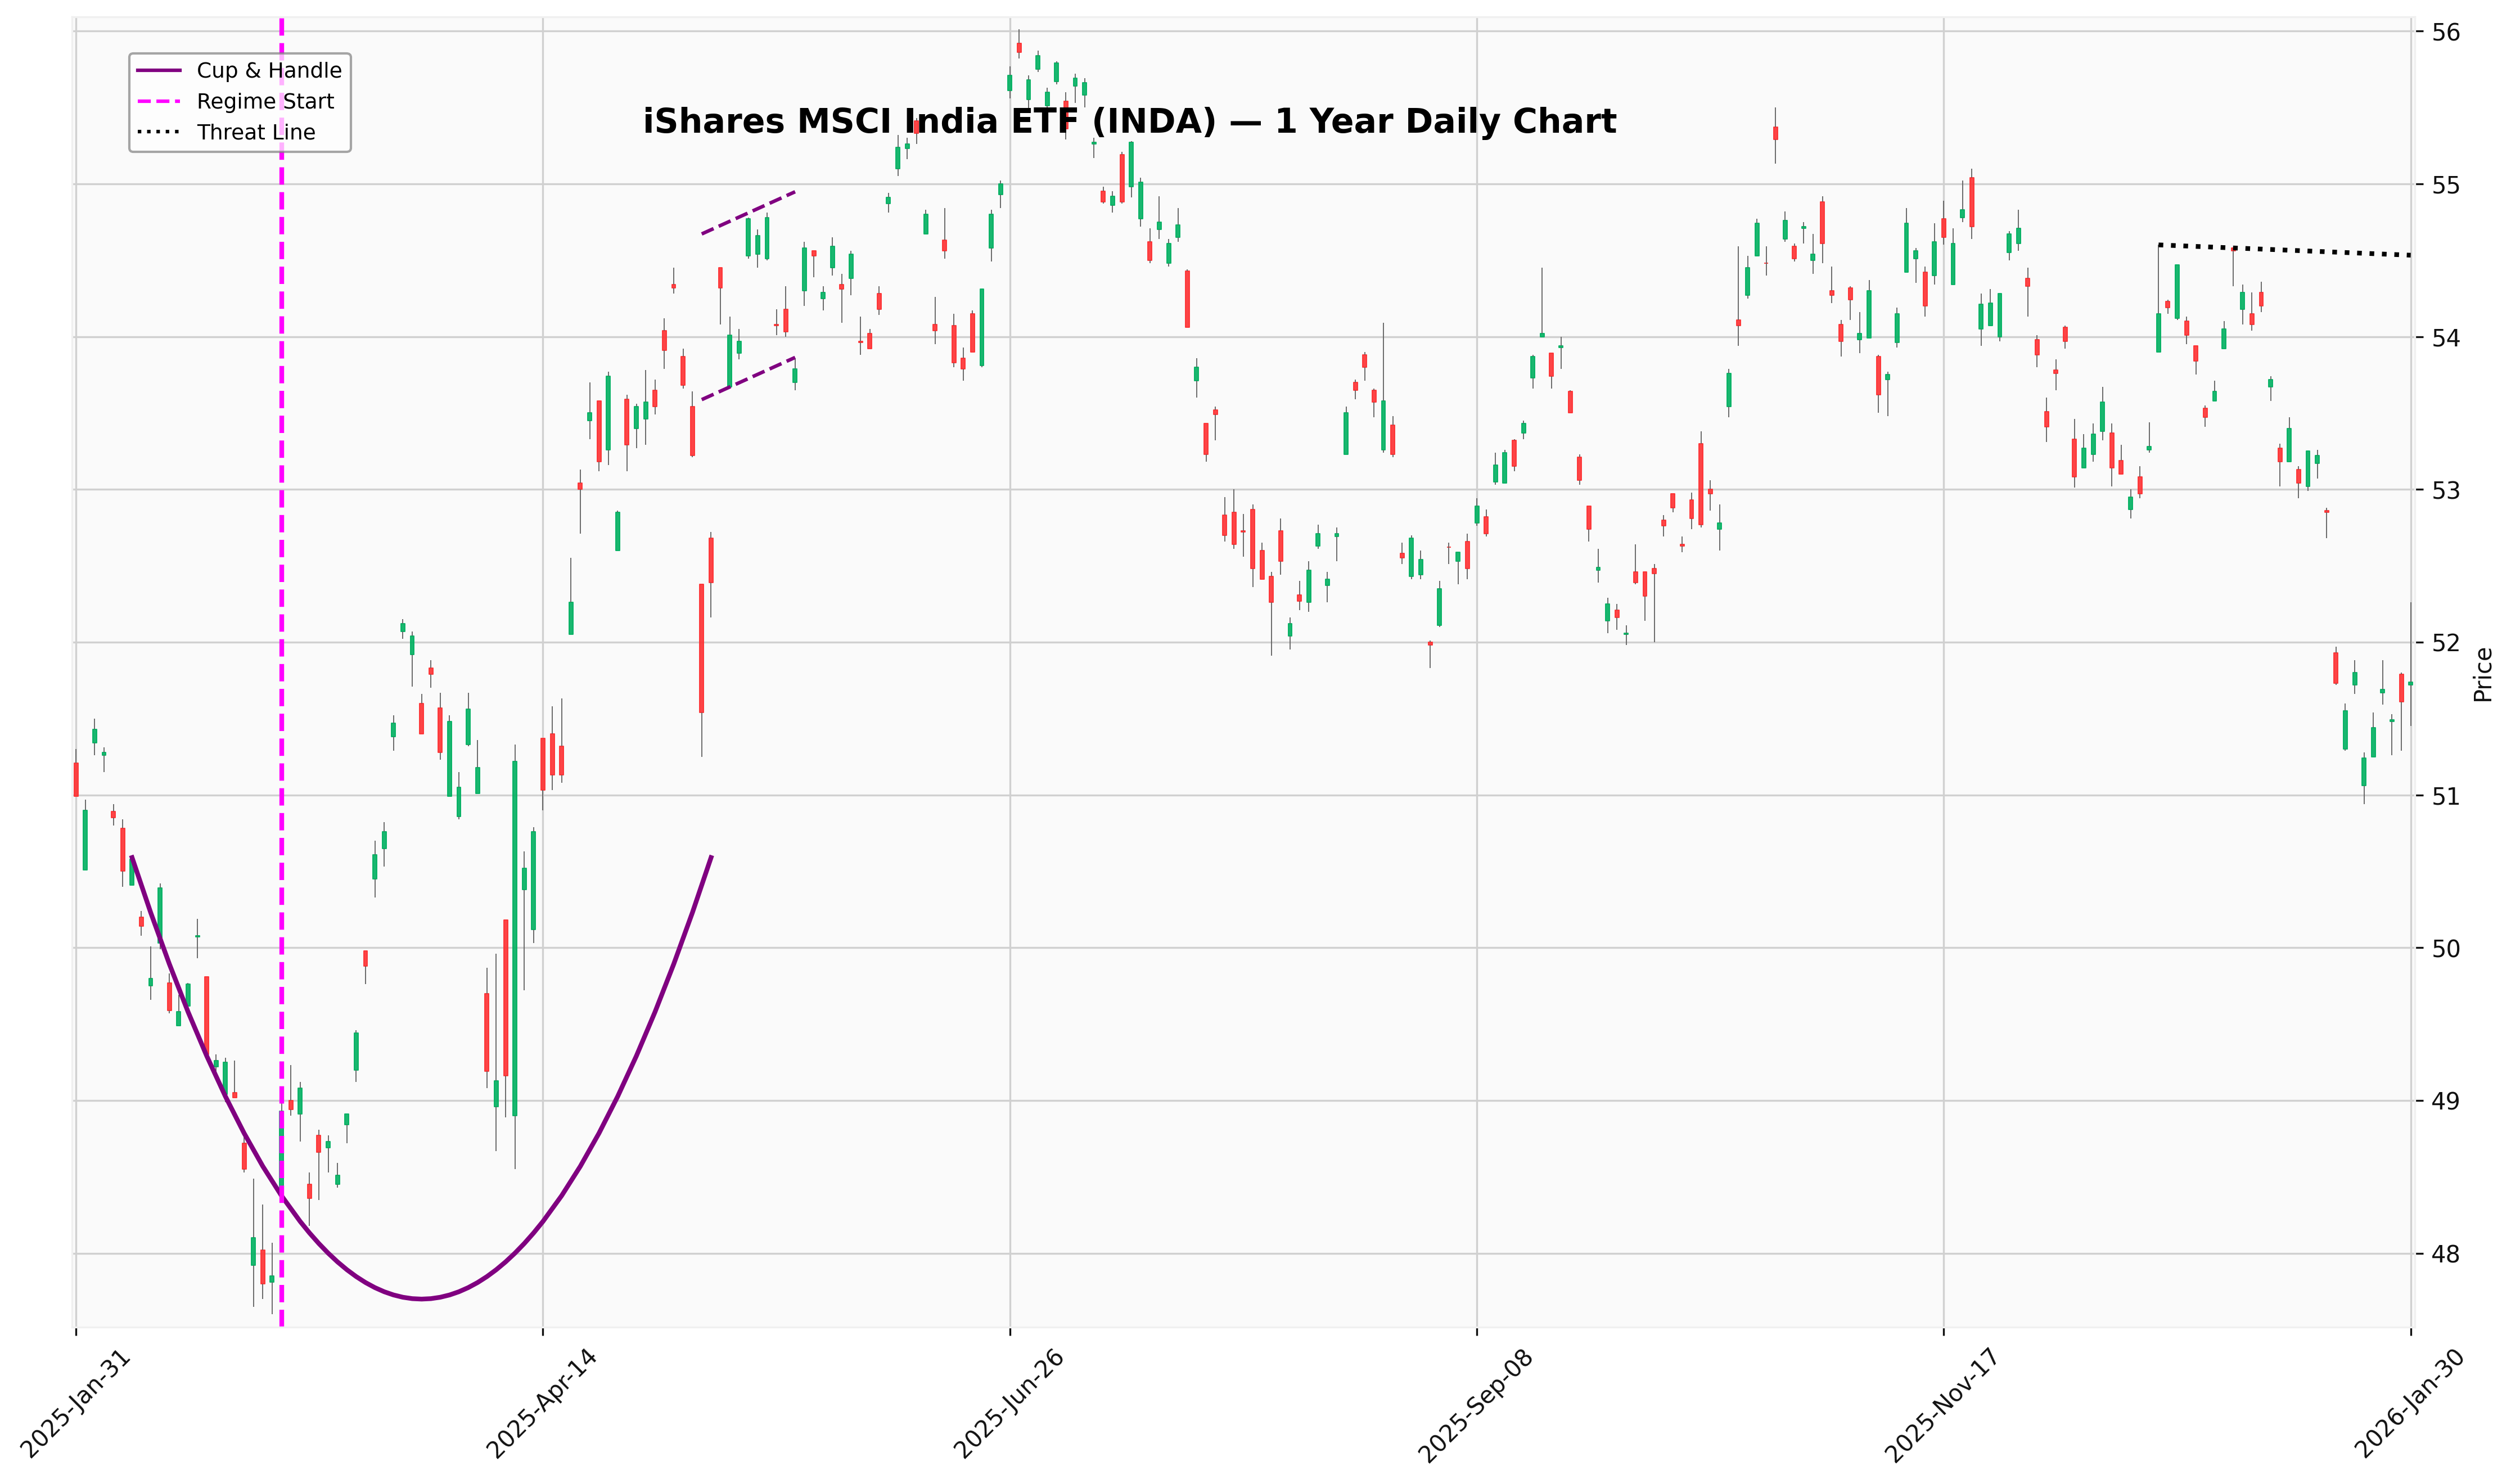
MSCI India
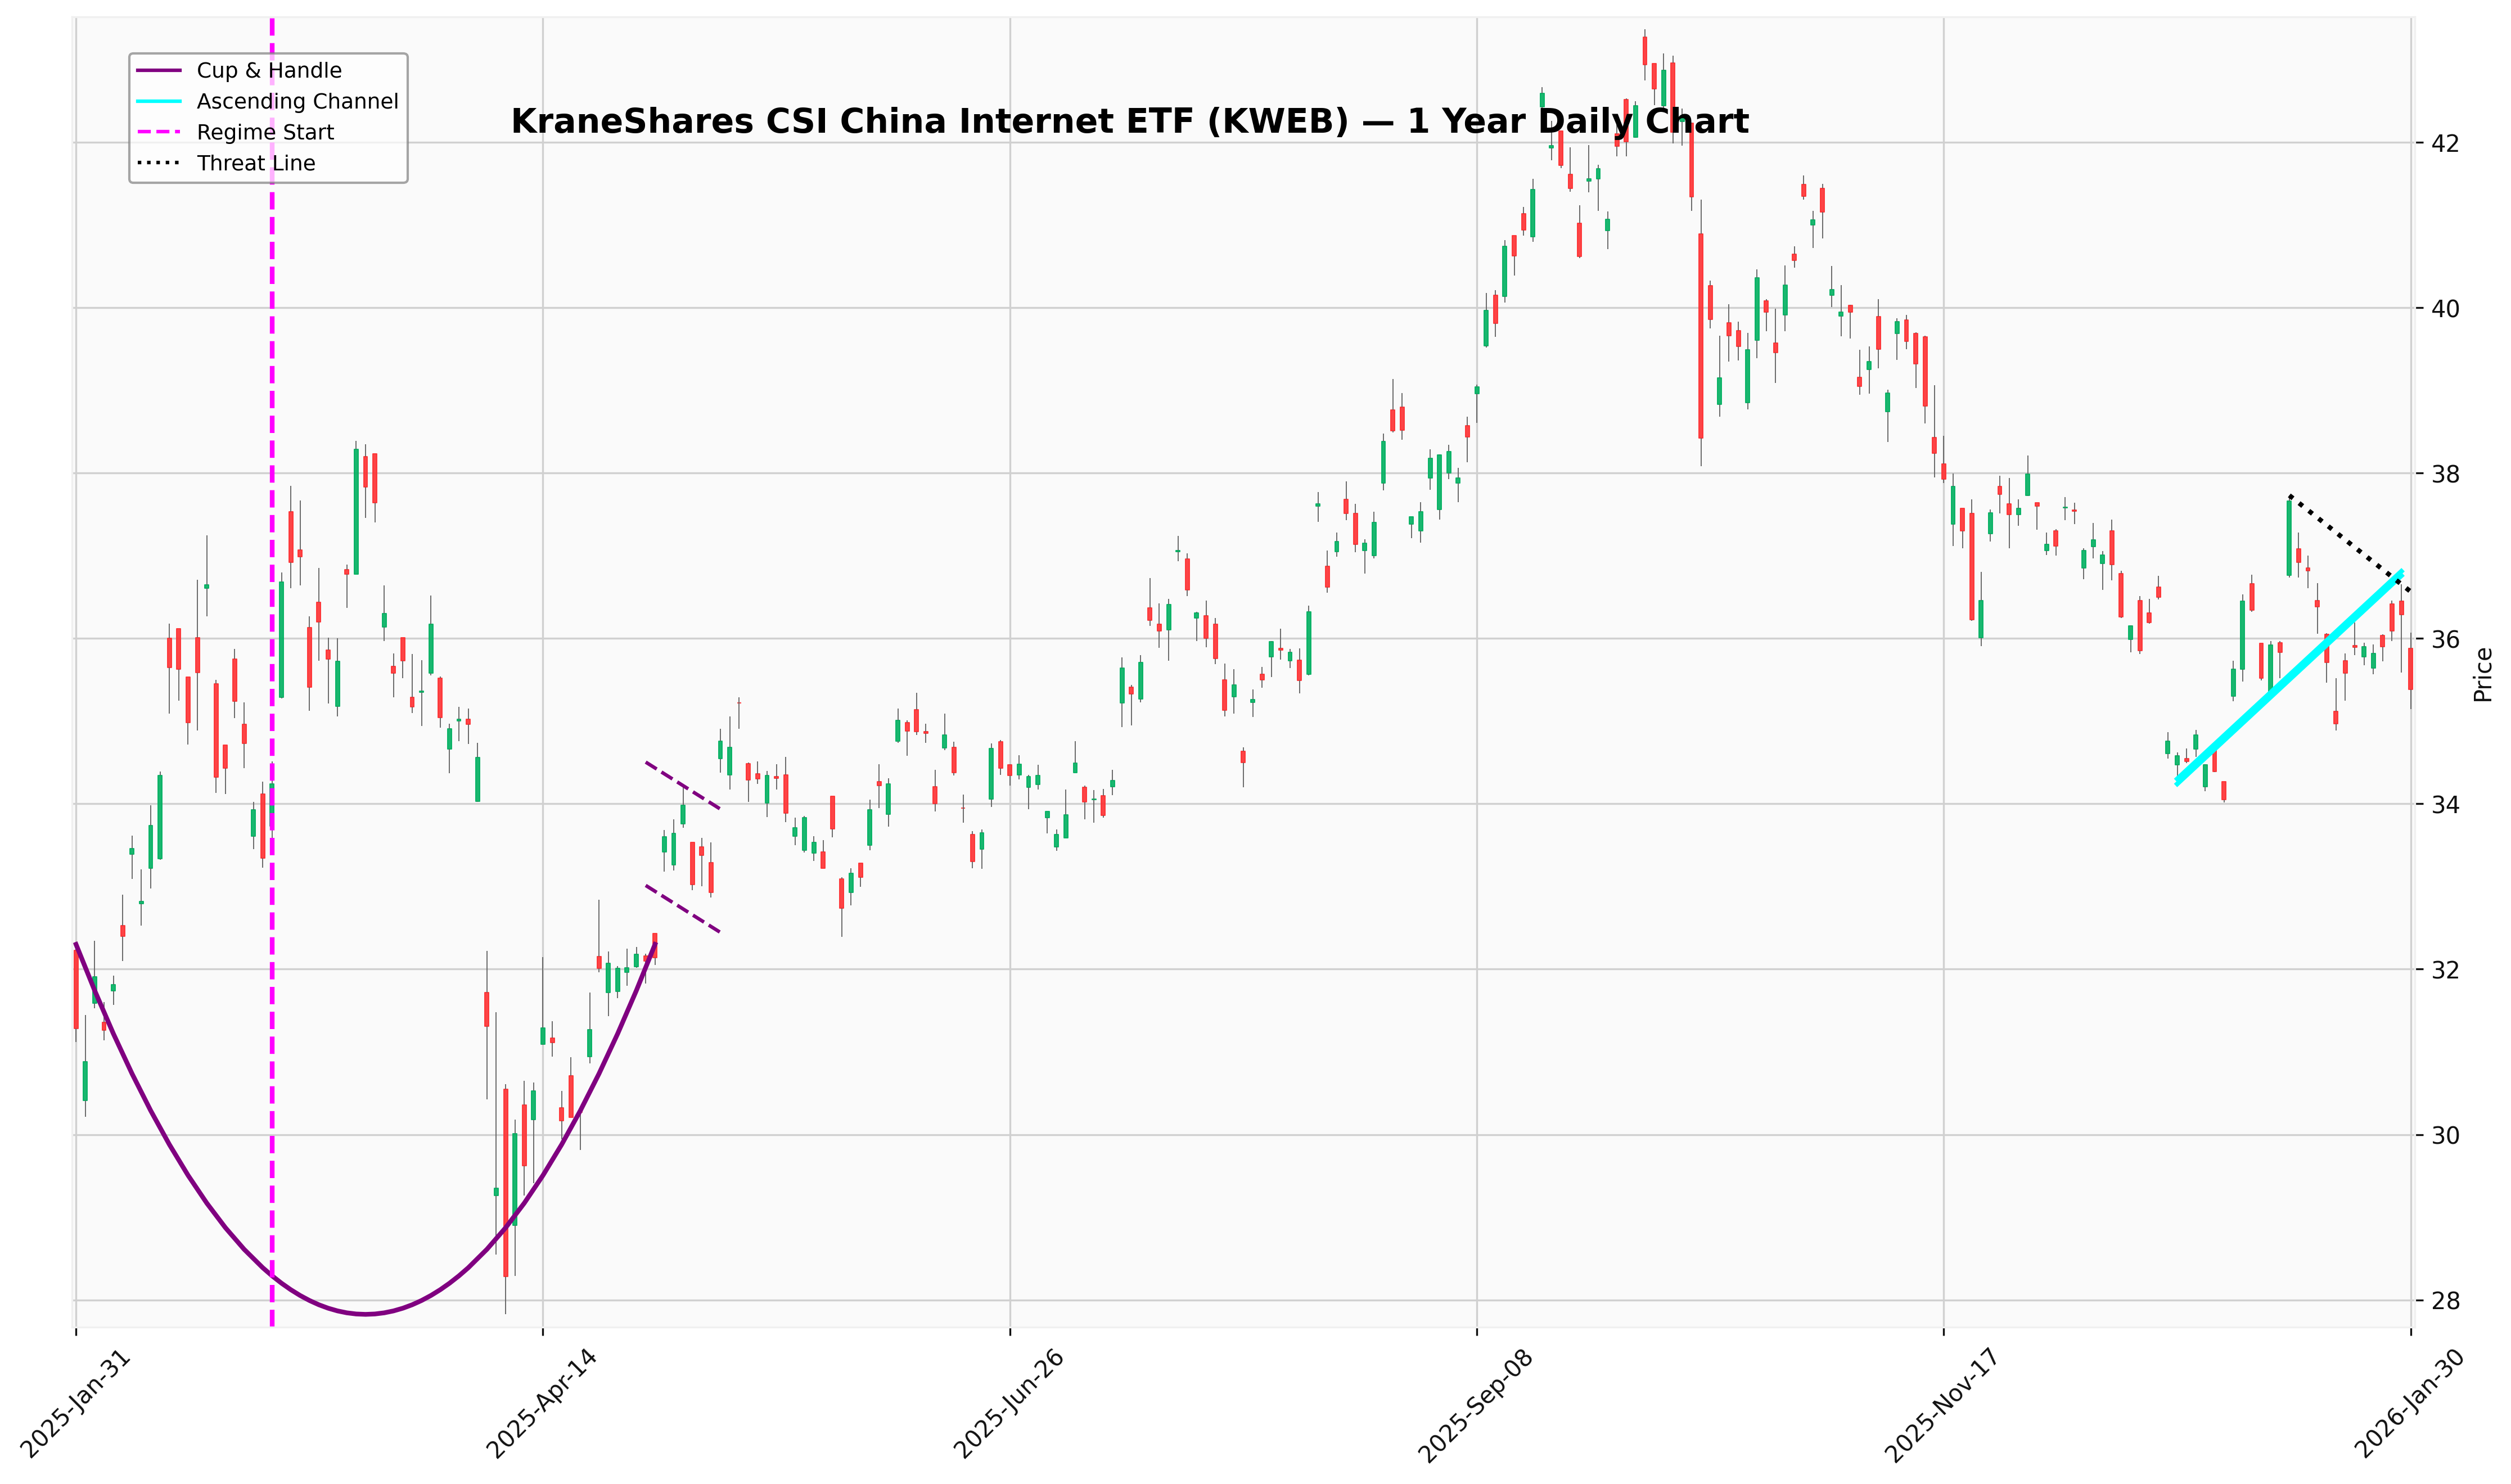
KraneShares CSI China Internet
McClellan Summation Index.
McClellan Summation Index
Bondaleros
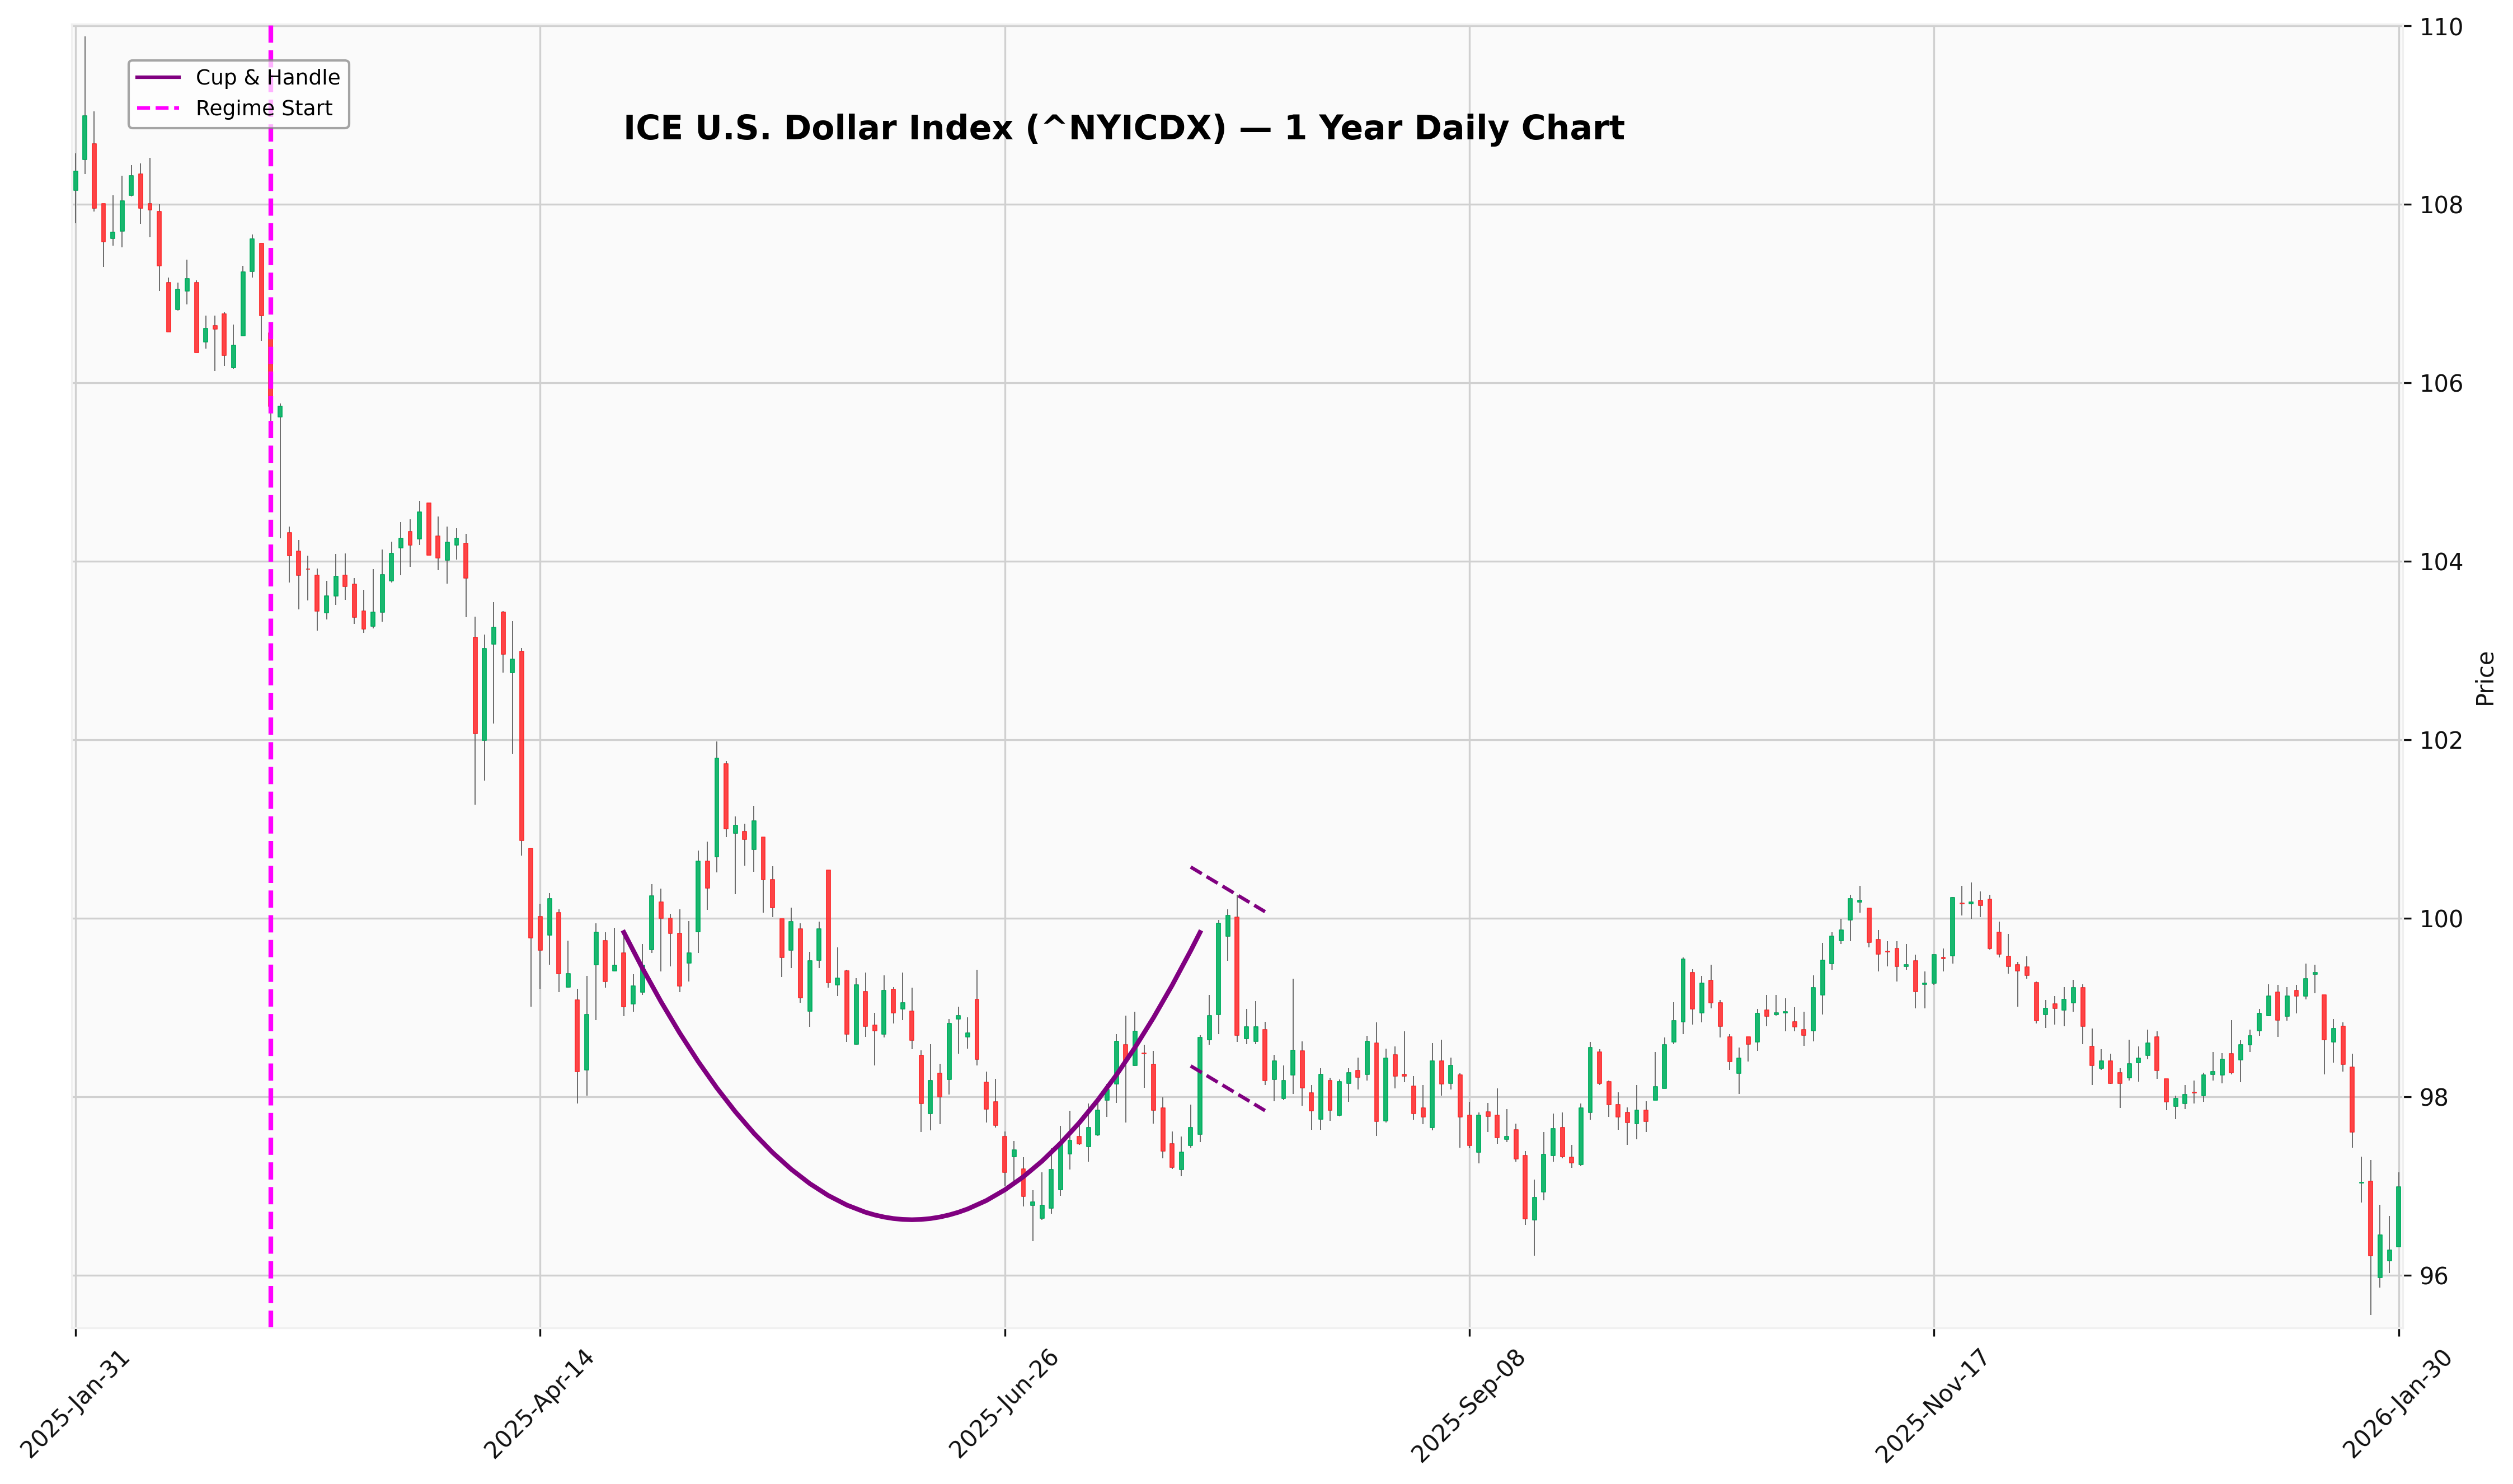
US DOllar
DELTA Market Sentiment
DELTA Market Sentiment
Insider Transation Ratio
Insider Transation Ratio
Citi Panic/Euphoria
Citi Panic/Euphoria
Repo: tyoungg/substack
Detected Patterns
Head and Shoulders
Identifies a chart formation that often signals a bullish-to-bearish trend reversal.
It is commonly used to anticipate potential breakdowns after an extended uptrend.
Double Top and Double Bottom
Patterns that form when price tests the same level twice without breaking through.
These often suggest exhaustion and a potential reversal at key support or resistance.
Triangles
Consolidation formations where price range contracts over time.
Ascending, descending, and symmetrical triangles often precede volatility expansion.
Flags
Short-term continuation patterns that form after a sharp price move.
They typically represent brief pauses before the prevailing trend resumes.
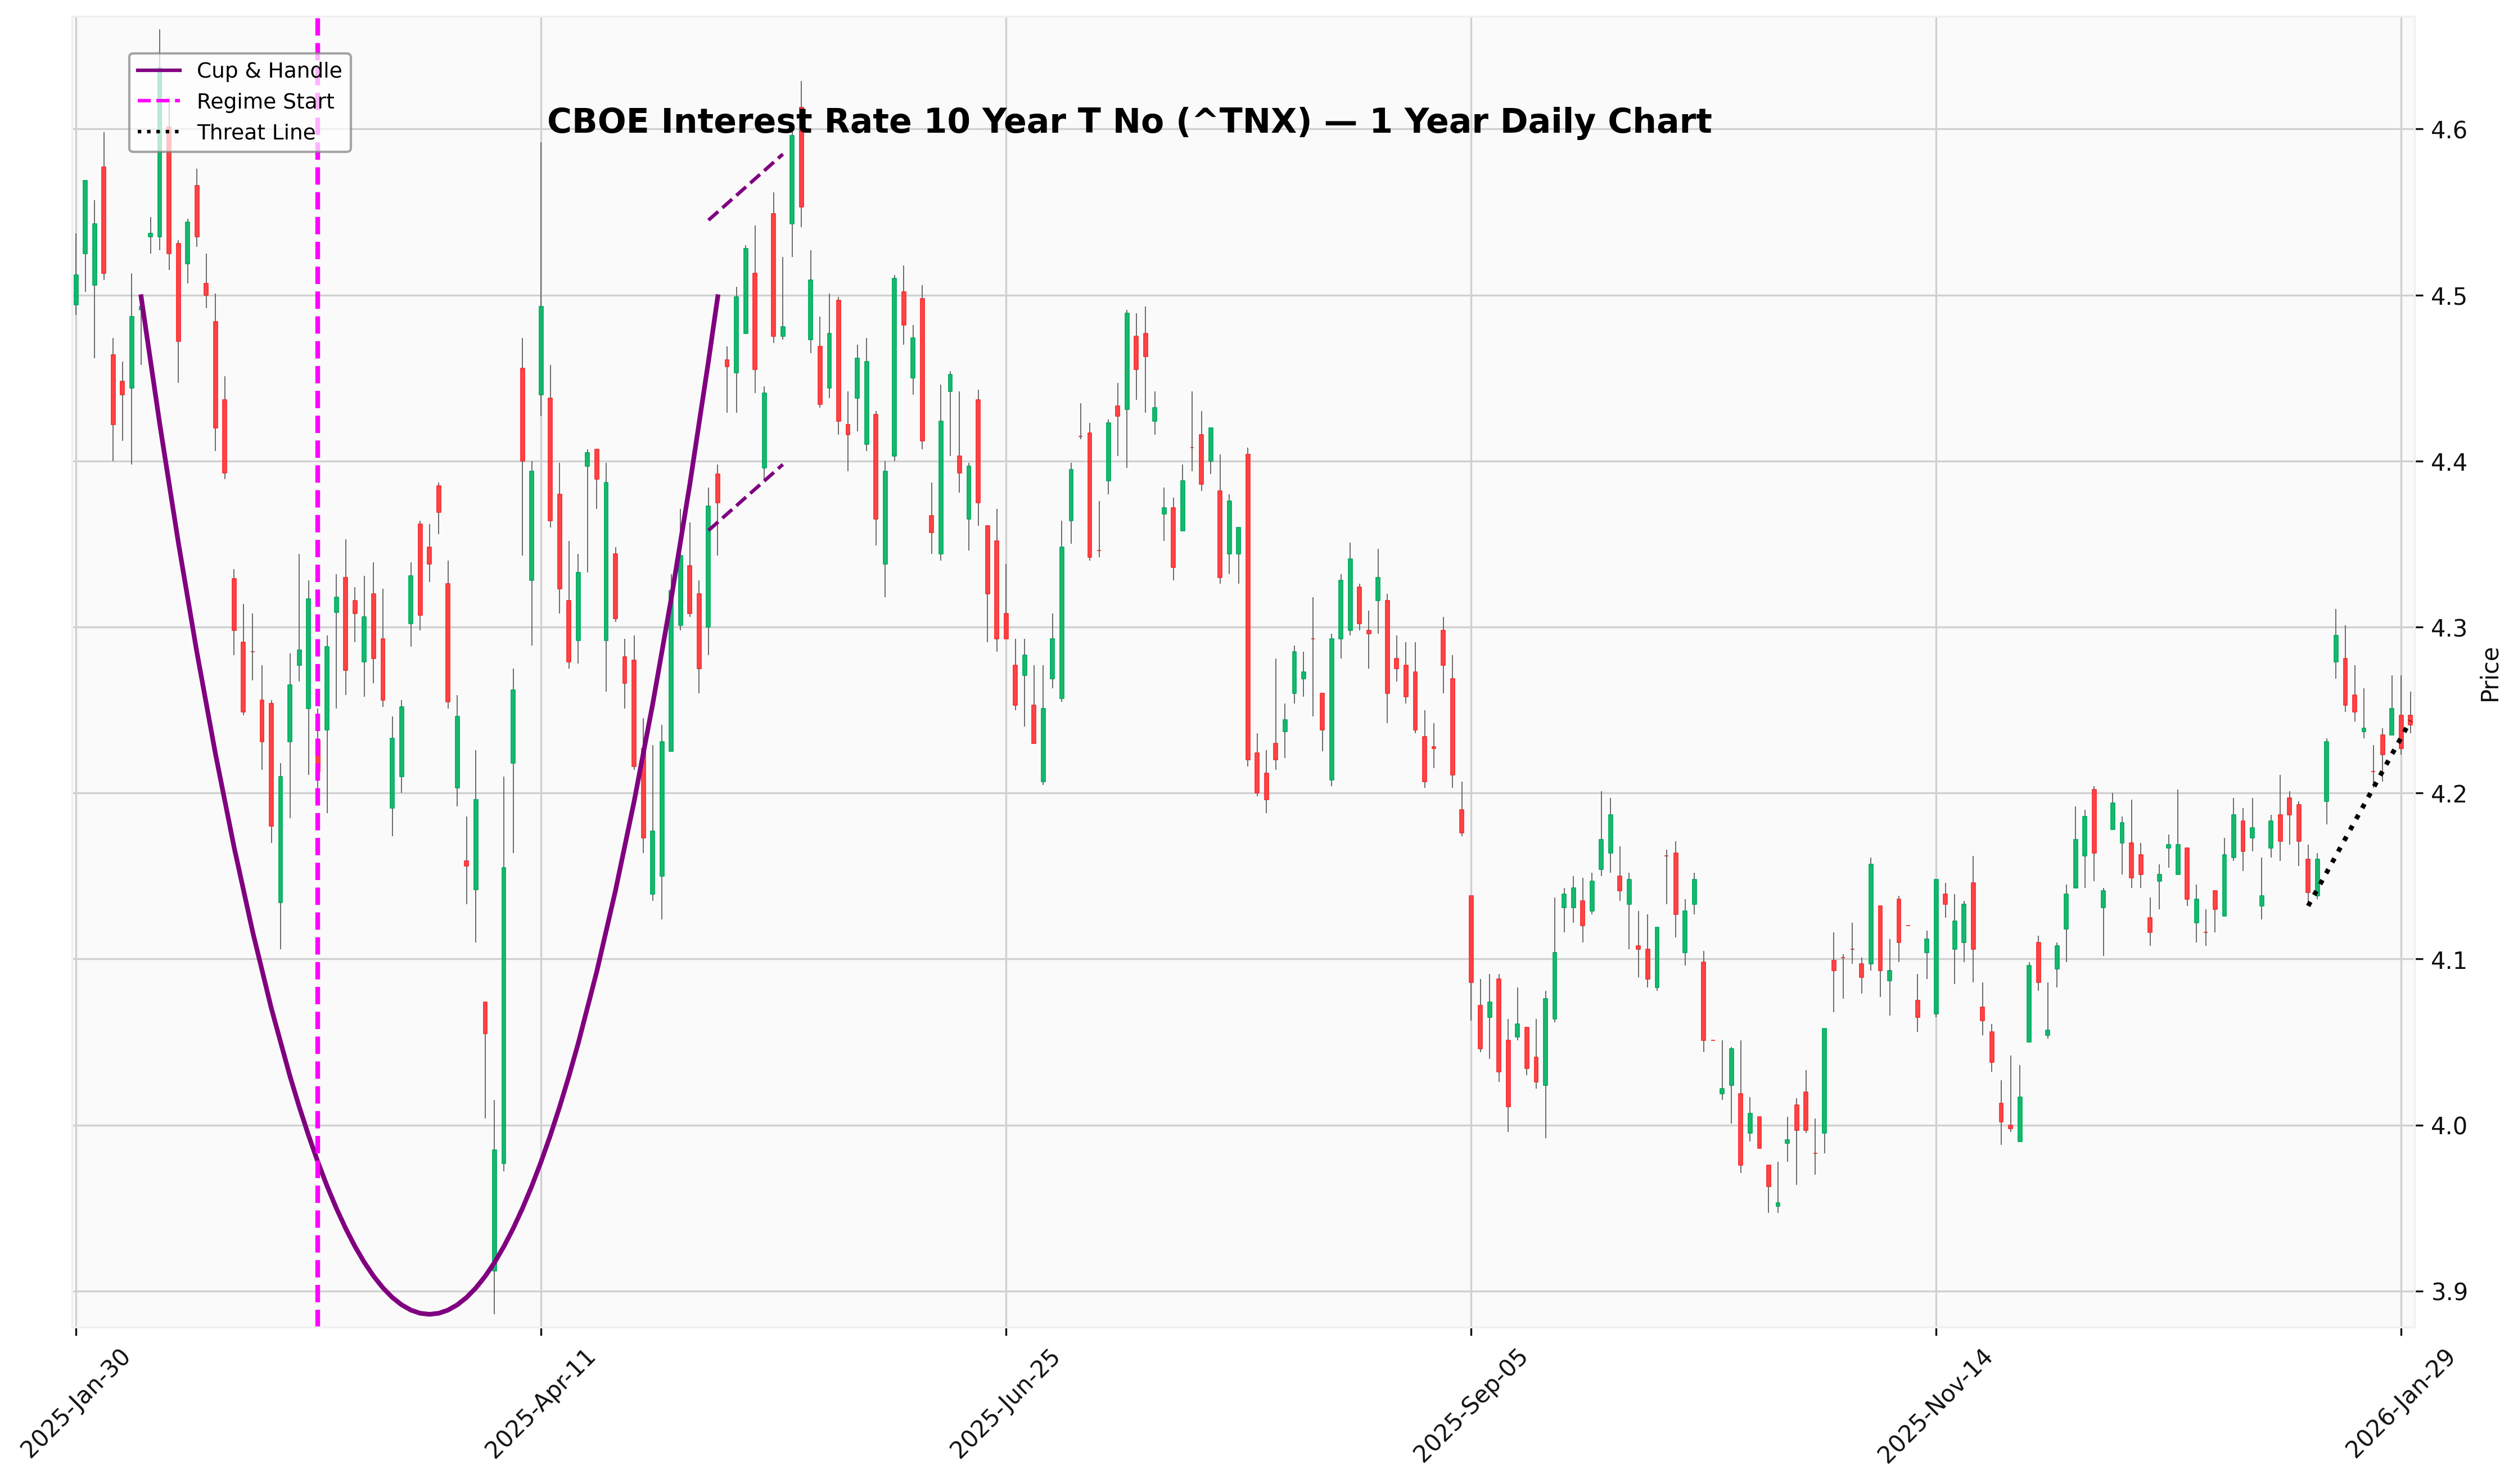
Cup and Handle
A bullish continuation pattern resembling a rounded base followed by shallow consolidation.
It is often used to identify breakout opportunities within longer-term uptrends.
Price Channels / Channel
Two parallel trendlines that contain price movement within a controlled trend.
Channels help visualize trend strength and potential support and resistance zones.
Trendline
A line connecting key highs or lows to indicate directional pressure.
Breaks in trendlines may signal shifts in momentum or regime.
Horizontal Zone
Represents areas of price memory where trading activity previously clustered.
These zones often act as support or resistance when revisited.
Shelf
A period of sideways consolidation following directional movement.
Shelves often precede either continuation or rejection depending on context.
Regime Start
Marks a contextual reset in market behavior or structure.
It is useful for segmenting analysis and avoiding assumptions based on prior conditions.
Threat Line
A boundary representing elevated risk to the current pattern or bias.
A breach of the threat line may invalidate the prevailing interpretation.